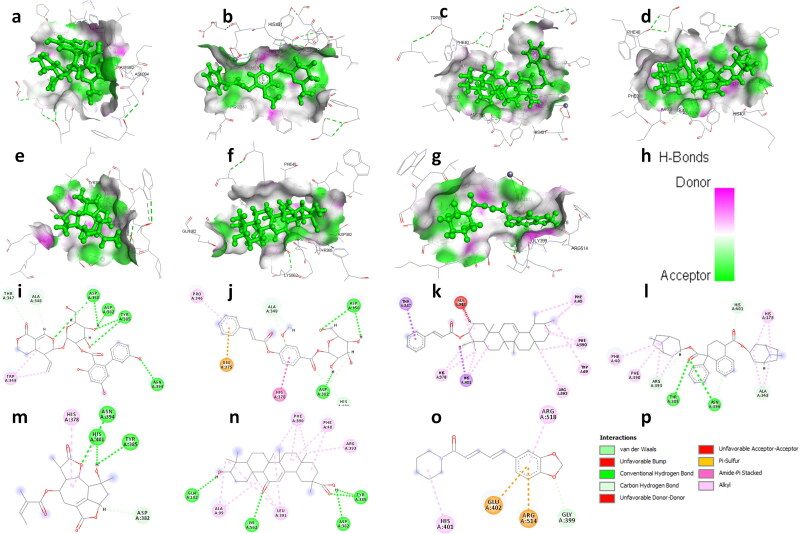
Figure 2.
3D structural views of ligand-binding site. The 3D structures display H-bond interactions (green dashed lines) of ligands (a) amarogentin (b) kutkin, (c) ἀ-amyrin, (d) belladonnine, (e) eufoliatorin, (f) glycyrrhetic acid, (g) piperine and (h) represent the color intensity of hydrogen bonds with the Angiotensin-converting enzyme-2 (1R42). The i, j, k, l, m, n, o demonstrated the 2D structural views of ligand-binding site of amarogentin, kutkin, ἀ-amyrin, belladonnine, eufoliatorin, glycyrrhetic acid, piperine and p represents the H-bonding (dark green circles associated with the green dashed lines); van der Waals forces (medium light green circles); carbon-oxygen dipole-dipole interaction (light green circles with dashed lines); alkyl-pi interactions (light pink circles with dashed lines); T-shaped pi-pi stacking and (parallel) pi-pi stacking (both indicated with dark violet circles); cation-pi interaction (orange circle). The blue halo surrounding the interacting residues represents the solvent accessible surface that is proportional to its diameter. Images were generated using Discovery Studio Visualizer 4.5.

