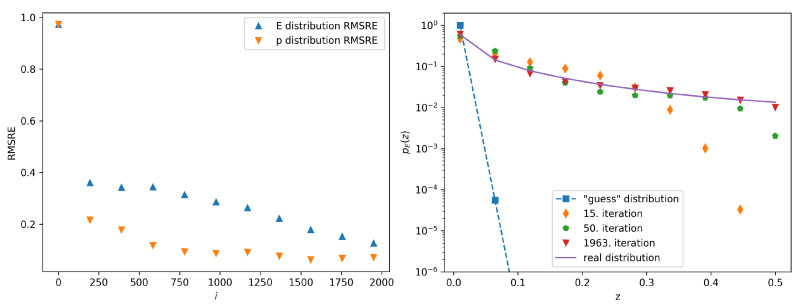
Figure 4.
The left panel shows the calculated error margin vs. the iteration number in the case of the guess distribution given by (7) with C set to 100. The right panel shows several iterations of the calculated probability distributions (symbols) compared to (full line). The 1963rd iteration is the final iteration of this procedure, since the stopping condition has been satisfied.

