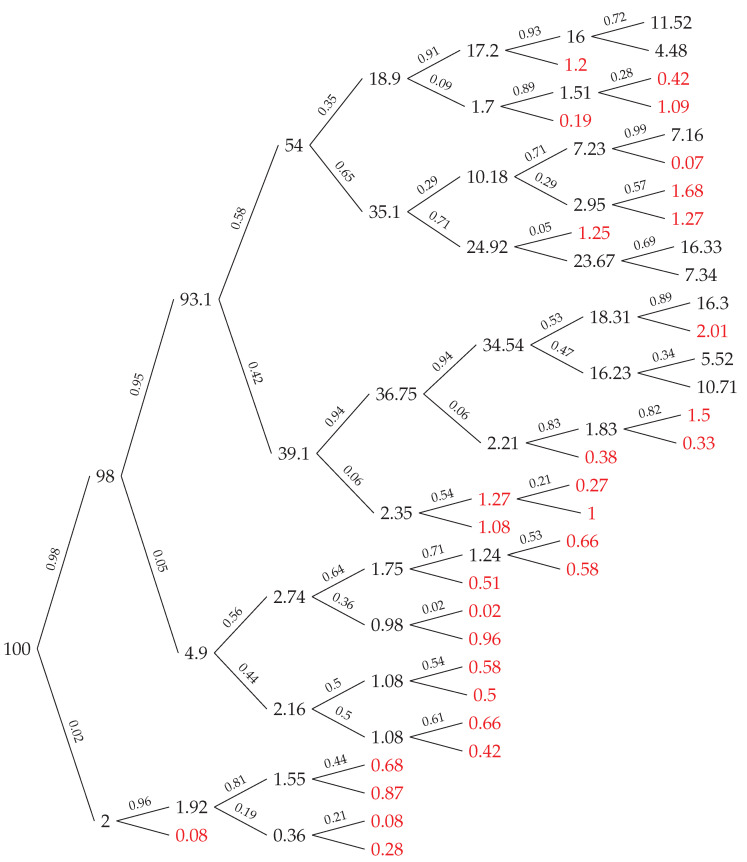
Figure A1.
An example of the operation of the jet generator. The number on the specific node represents the total energy for a given particle, while the number on the line connecting two nodes is the energy ratio z when decaying. The decay probability distribution in this image is constant. The maximum number of decays in a single branch has been set to 7, and the maximum number of particles in the jet has been set to 8. A particle stops to decay once its energy is too low (here set to 0.1). The particles coloured red are removed from the jet because their energy is too low.

