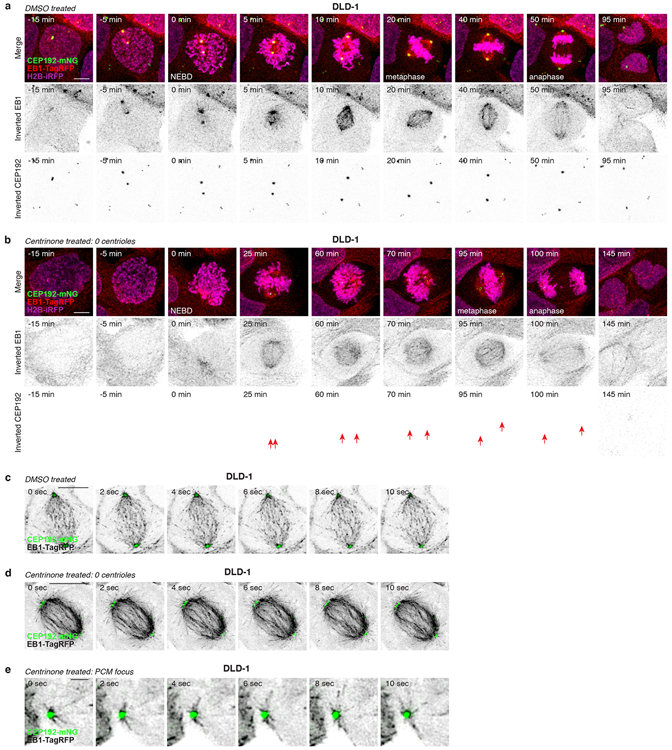
Extended Data Figure 6 (related to Figure 3). Non-centrosomal PCM foci nucleate microtubules and contribute to spindle assembly in DLD-1 cells.

(A) Representative time-lapse images of mitosis in control DLD-1 cells. n = 3, biological replicates. Scale bar, 5 μm.
(B) Representative time-lapse images of PCM foci formation during mitosis in acentrosomal DLD-1 cells. Scale bar, 5 μm. n = 3, biological replicates. Arrows indicate PCM foci.
(C) Representative time-lapse images of microtubule nucleation from centrosomes in the mitotic spindle of control DLD-1 cells. n = 3, biological replicates. Scale bar, 5 μm.
(D) Representative time-lapse images of microtubule nucleation from PCM foci incorporated into the mitotic spindle of acentrosomal DLD-1 cells. n = 3, biological replicates. Scale bar, 5 μm.
(E) Representative time-lapse images of microtubule nucleation from a PCM focus prior to its incorporation into the mitotic spindle of the acentrosomal cell shown in (D). n = 3, biological replicates. Scale bar, 1 μm.
