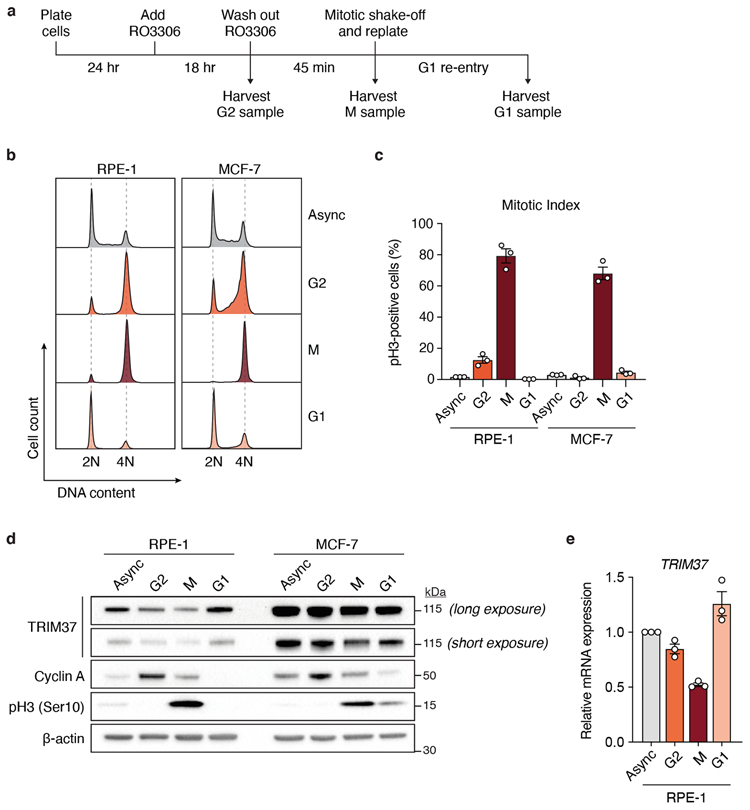
Extended Data Figure 9 (related to Figure 4). Cell cycle regulation of TRIM37 expression.

(A) Schematic of the experimental protocol used for cell cycle synchronisation. Samples were subjected to dual flow cytometry staining of phospho-Histone Ser10 (pH3) to mark mitotic cells and propidium iodide (PI) to determine synchronisation efficiency. M, mitotic phase.
(B) Flow cytometric DNA content analysis of samples harvested according to (A). Left, RPE-1; Right, MCF-7. Async, asynchronous.
(C) Mitotic index of cell cycle samples as determined by the percentage of pH3-positive cells with 4N DNA content. n = 3, biological replicates. Mean ± s.e.m.
(D) Immunoblot showing endogenous TRIM37, cyclin A and pH3 in samples analysed in (B). β-actin, loading control. For gel source data, see Supplementary Figure 1.
(E) RT-qPCR analysis indicating relative TRIM37 mRNA expression in RPE-1 cells analysed in (B). Data was normalised to TRIM37 mRNA expression in asynchronous cells. n = 3, biological replicates. Mean ± s.e.m.
