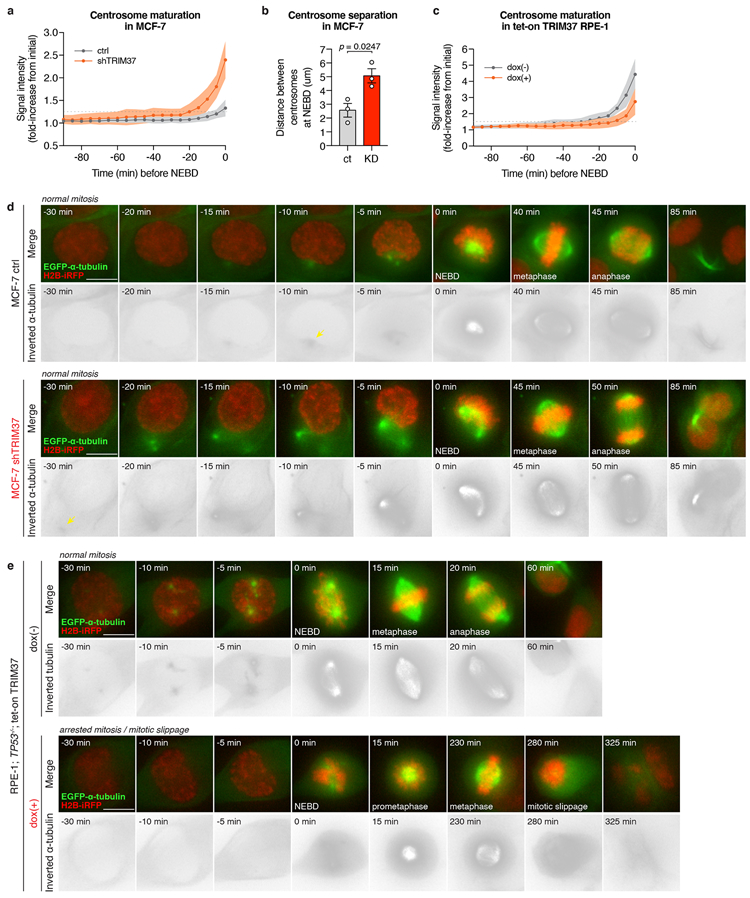
Extended Data Figure 10 (related to Figure 4). TRIM37 overexpression delays centrosome maturation in G2/M phase.

(A) Quantification of centrosomal α-tubulin intensity from time-lapse movies of dividing MCF-7 cells expressing either control or TRIM37-targeting shRNA. Quantitation of >20 cells. Mean ± s.e.m.
(B) Quantification of the distance between the two centrosomes at NEBD in MCF-7 cells. n = 3, biological replicates, each comprising >12 cells. P values, unpaired two-tailed t-test. Mean ± s.e.m.
(C) Quantification of centrosomal α-tubulin intensity from time-lapse movies of dividing RPE-1 tet-on TRIM37 cells. Quantitation of >20 cells. Mean ± s.e.m.
(D) Representative time-lapse images of centrosome maturation in MCF-7 cells. n = 3, biological replicates. Scale bars, 5 μm.
(E) Representative time-lapse images of centrosome maturation in RPE-1 tet-on TRIM37 cells. n = 3, biological replicates. Scale bars, 5 μm.
