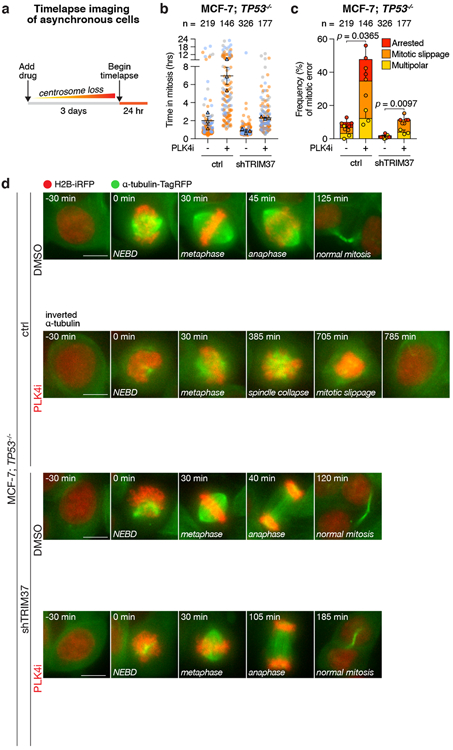
Figure 2. PLK4 inhibition triggers mitotic catastrophe in TRIM37 amplified cancer cells.

(A) Experimental schematic.
(B) Quantification of mitotic duration in control TP53−/− MCF-7 cells compared to those expressing a TRIM37-shRNA. Cells were treated with DMSO (control) or centrinone (PLK4i, 125 nM) for 3 days prior to imaging. Triangles represent the mean for each biological replicate; coloured circles show individual data points from each of the replicates. Data acquired across n = 3, biological replicates, each with >40 cells. Mean ± s.e.m.
(C) Quantification of mitotic phenotypes from (B) in control TP53−/− MCF-7 cells compared to those expressing a TRIM37-shRNA. Data acquired across n = 3, biological replicates, each with >40 cells. P values, unpaired two-tailed t-test. Mean ± s.e.m.
(D) Representative time-lapse images of mitotic progression in DMSO or centrinone (125 nM)-treated TP53−/− MCF-7 cells expressing vector control or TRIM37-shRNA. Representative data; n = 3, biological replicates. Cells are labelled with H2B-iRFP and TagRFP-α-tubulin. Scale bars, 5 μm.
