
Figure 3. PCM sequestration by TRIM37 drives mitotic catastrophe in acentrosomal cells.
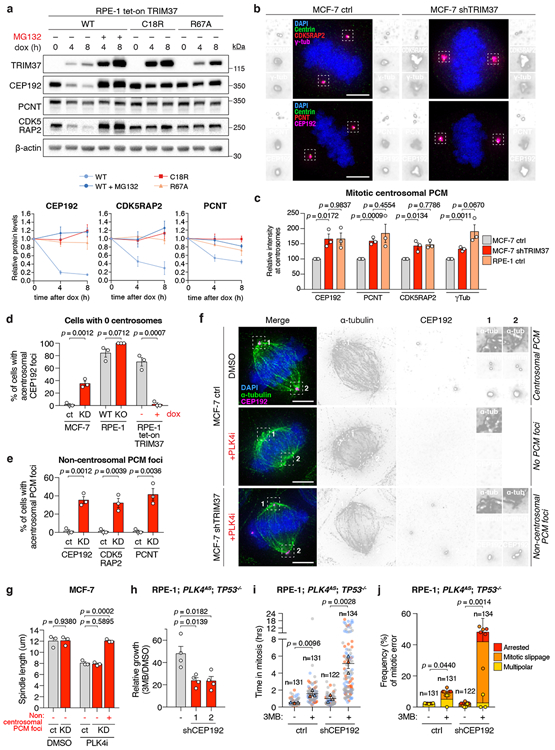
(A) Top, immunoblot showing PCM levels following overexpression of wild-type TRIM37(WT), RING domain mutant TRIM37(C18R), or ubiquitin-transfer defective mutant TRIM37(R67A). For gel source data, see Supplementary Figure 1. Bottom, normalised PCM levels relative to 0 h, representative of n = 3, biological replicates. Mean ± s.e.m.
(B) Centrosomal PCM levels in mitotic control or TRIM37-depleted cells. Representative images, n = 3, biological replicates. Scale bars, 5 μm.
(C) Quantification of centrosomal PCM signal in mitotic cells. n = 3, biological replicates. P values, unpaired two-tailed t-test. Mean ± s.e.m.
(D) Quantification of mitotic CEP192 foci in centrinone-treated cells lacking centrosomes. n = 3, biological replicates, each comprising >30 cells. P values, unpaired two-tailed t-test. Mean ± s.e.m.
(E) Quantification of mitotic PCM foci in centrinone-treated cells lacking centrosomes. n = 3, biological replicates, each comprising >30 cells. P values, unpaired two-tailed t-test. Mean ± s.e.m.
(F) Representative images for (E). Scale bars, 5 μm.
(G) Quantification of mitotic spindle length in control and TRIM37-shRNA expressing cells. n = 3, biological replicates, each comprising >10 cells. P values, unpaired two-tailed t-test. Mean ± s.e.m.
(H) Relative growth of 3MB-PP1-treated control or CEP192-shRNA expressing cells. n = 4, biological replicates. P values, unpaired two-tailed t-test. Mean ± s.e.m.
(I) Mitotic duration in of the cells described in (H) expressing H2B-EGFP and TagRFP-tubulin. Cells were grown in DMSO or 3MB-PP1 for 3 days prior to imaging. Triangles, mean for each biological replicate; coloured circles, individual data points from each replicate. n = 3, biological replicates, each comprising >30 cells. P values, unpaired two-tailed t-test. Mean ± s.e.m.
(J) Frequency of mitotic errors quantified in the same samples as described in (I). n = 3, biological replicates, each comprising >30 cells. P values, unpaired two-tailed t-test. Mean ± s.e.m.