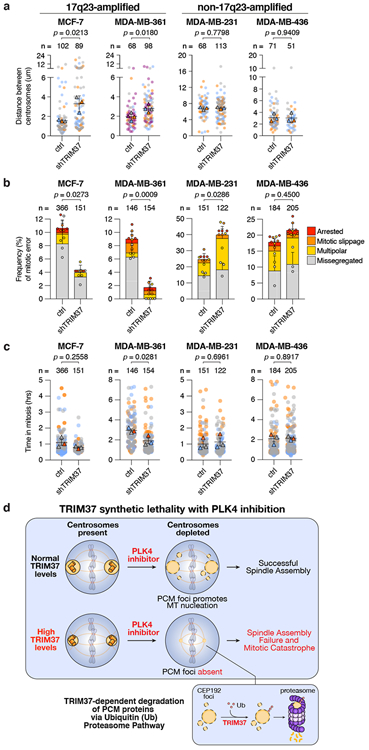
Figure 4. TRIM37 overexpression delays centrosome separation in late G2 phase and promotes mitotic errors.

(A) Quantification of the distance between the two centrosomes at NEBD in control MCF-7, MDA-MB-361, MDA-MB-231, and MDA-MB-436 cells compared to those expressing a TRIM37-shRNA. Data acquired across n = ≥3, biological replicates, each with 8 - 45 cells. P values, unpaired two-tailed t-test. Mean ± s.e.m.
(B) Quantification of mitotic phenotypes in control MCF-7, MDA-MB-361, MDA-MB-231, and MDA-MB-436 cells compared to those expressing a TRIM37-shRNA. Data acquired across n = 3, biological replicates, each with >40 cells. P values, unpaired two-tailed t-test. Mean ± s.e.m.
(C) Quantification of mitotic duration in control MCF-7, MDA-MB-361, MDA-MB-231, and MDA-MB-436 cells compared to those expressing a TRIM37-shRNA. Triangles represent the mean for each biological replicate; coloured circles show individual data points from each of the replicates. Data acquired across n = 3, biological replicates, each with >40 cells. P values, unpaired two-tailed t-test. Mean ± s.e.m.
(D) A model illustrating the synthetic lethal effect of PLK4 inhibition with TRIM37 overexpression in 17q23-amplified breast cancer cells.
