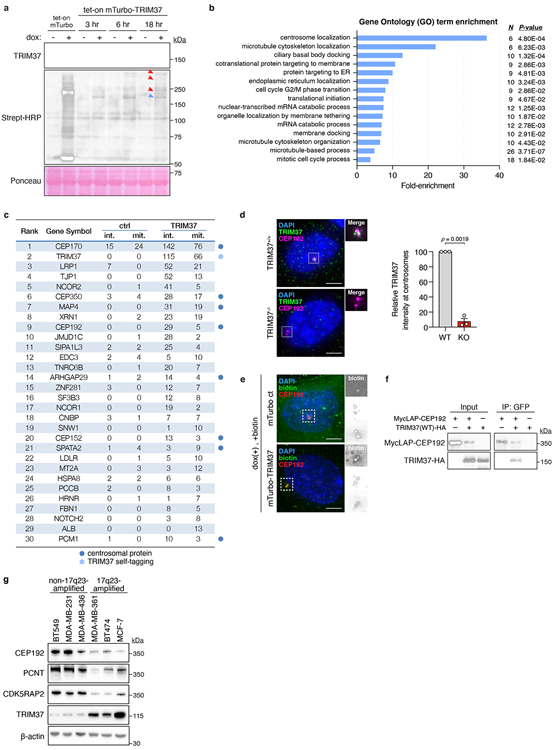
Extended Data Figure 4 (related to Figure 3). TRIM37 localises to centrosomes, where it interacts with, and regulates the abundance of PCM proteins.

(A) Immunoblot showing TRIM37 and biotinylated proximity interactors. Ponceau-stained blot indicates loading. Data is from a single experiment performed in duplicate. For gel source data, see Supplementary Figure 1.
(B) Gene ontology analysis of mass spectrometry data.
(C) Thresholded mass spectrometry results displaying the top 30 proximity interactors by spectral count. Interactors were filtered to isolate those with >2x more peptides in the mTurbo-TRIM37 sample compared to control.
(D) Left, immunofluorescence of TRIM37 in TRIM37+/+ and TRIM37−/− RPE-1 cells. Scale bars, 5 μm. Right, quantification of TRIM37 intensity at the centrosome in RPE-1 cells. n = 3, biological replicates, each comprising >40 cells. P values, unpaired two-tailed t-test. Mean ± s.e.m.
(E) Immunofluorescence of biotin-labelled proteins in mTurbo cell lines. Representative data; n = 3. Scale bars, 5 μm.
(F) Co-immunoprecipitation showing the interaction of TRIM37 with CEP192. Representative data; n = 3, biological replicates. For gel source data, see Supplementary Figure 1.
(G) Immunoblot showing the levels of TRIM37 and PCM components in non-17q23-amplified versus 17q23-amplified cell lines. β-Actin, loading control. Representative data; n = 3, biological replicates. For gel source data, see Supplementary Figure 1.
