
Extended Data Figure 5 (related to Figure 3). TRIM37 suppresses microtubule nucleation by the centrosome and supresses the formation of non-centrosomal PCM foci.
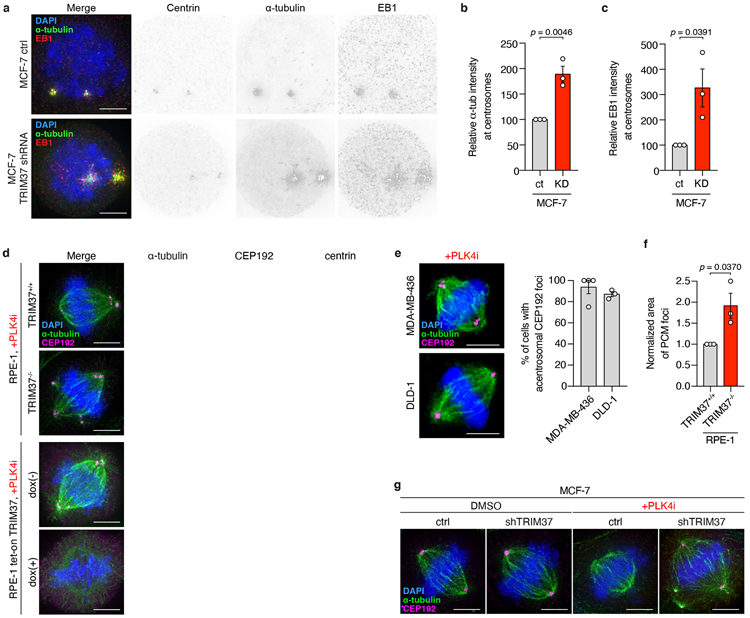
(A) Microtubule regrowth following nocodazole washout in control and TRIM37-shRNA expressing MCF-7 mitotic cells. Representative images from (B). n = 3, biological replicates. Scale bars, 5 μm.
(B) Quantification of microtubule regrowth following nocodazole washout in control and TRIM37-shRNA expressing MCF-7 mitotic cells. n = 3, biological replicates, each with >25 cells. P values, unpaired two-tailed t-test. Mean ± s.e.m.
(C) Quantification of centrosomal EB1 intensity following nocodazole washout in control and TRIM37-shRNA expressing MCF-7 mitotic cells. n = 3, biological replicates, each with >25 cells. P values, unpaired two-tailed t-test. Mean ± s.e.m.
(D) Representative images of mitotic PCM foci in acentrosomal RPE-1 cells described in Figure 3d. n = 3, biological replicates. Scale bars, 5 μm.
(E) Left, representative images of mitotic PCM foci in acentrosomal MDA-MB-436 and DLD-1 cells. Scale bars, 5 μm. Right, Quantification of mitotic PCM foci in centrinone-treated MDA-MB-436 and DLD-1 cells that lacked centrosomes. n = >3, biological replicates, each comprising ≥84 cells for DLD-1 cells and ≥ 6 cells for MDA-MB-436 cells. Mean ± s.e.m.
(F) Quantification of CEP192 foci area in RPE-1 TRIM37+/+ vs TRIM37−/− cells in (D). n = 3, biological replicates, each comprising >20 cells. P values, unpaired two-tailed t-test. Mean ± s.e.m.
(G) Representative images for spindle length analysis in indicated MCF-7 cells described in Figure 3g. n = 3, biological replicates. Scale bars, 5 μm.