
Figure 4.
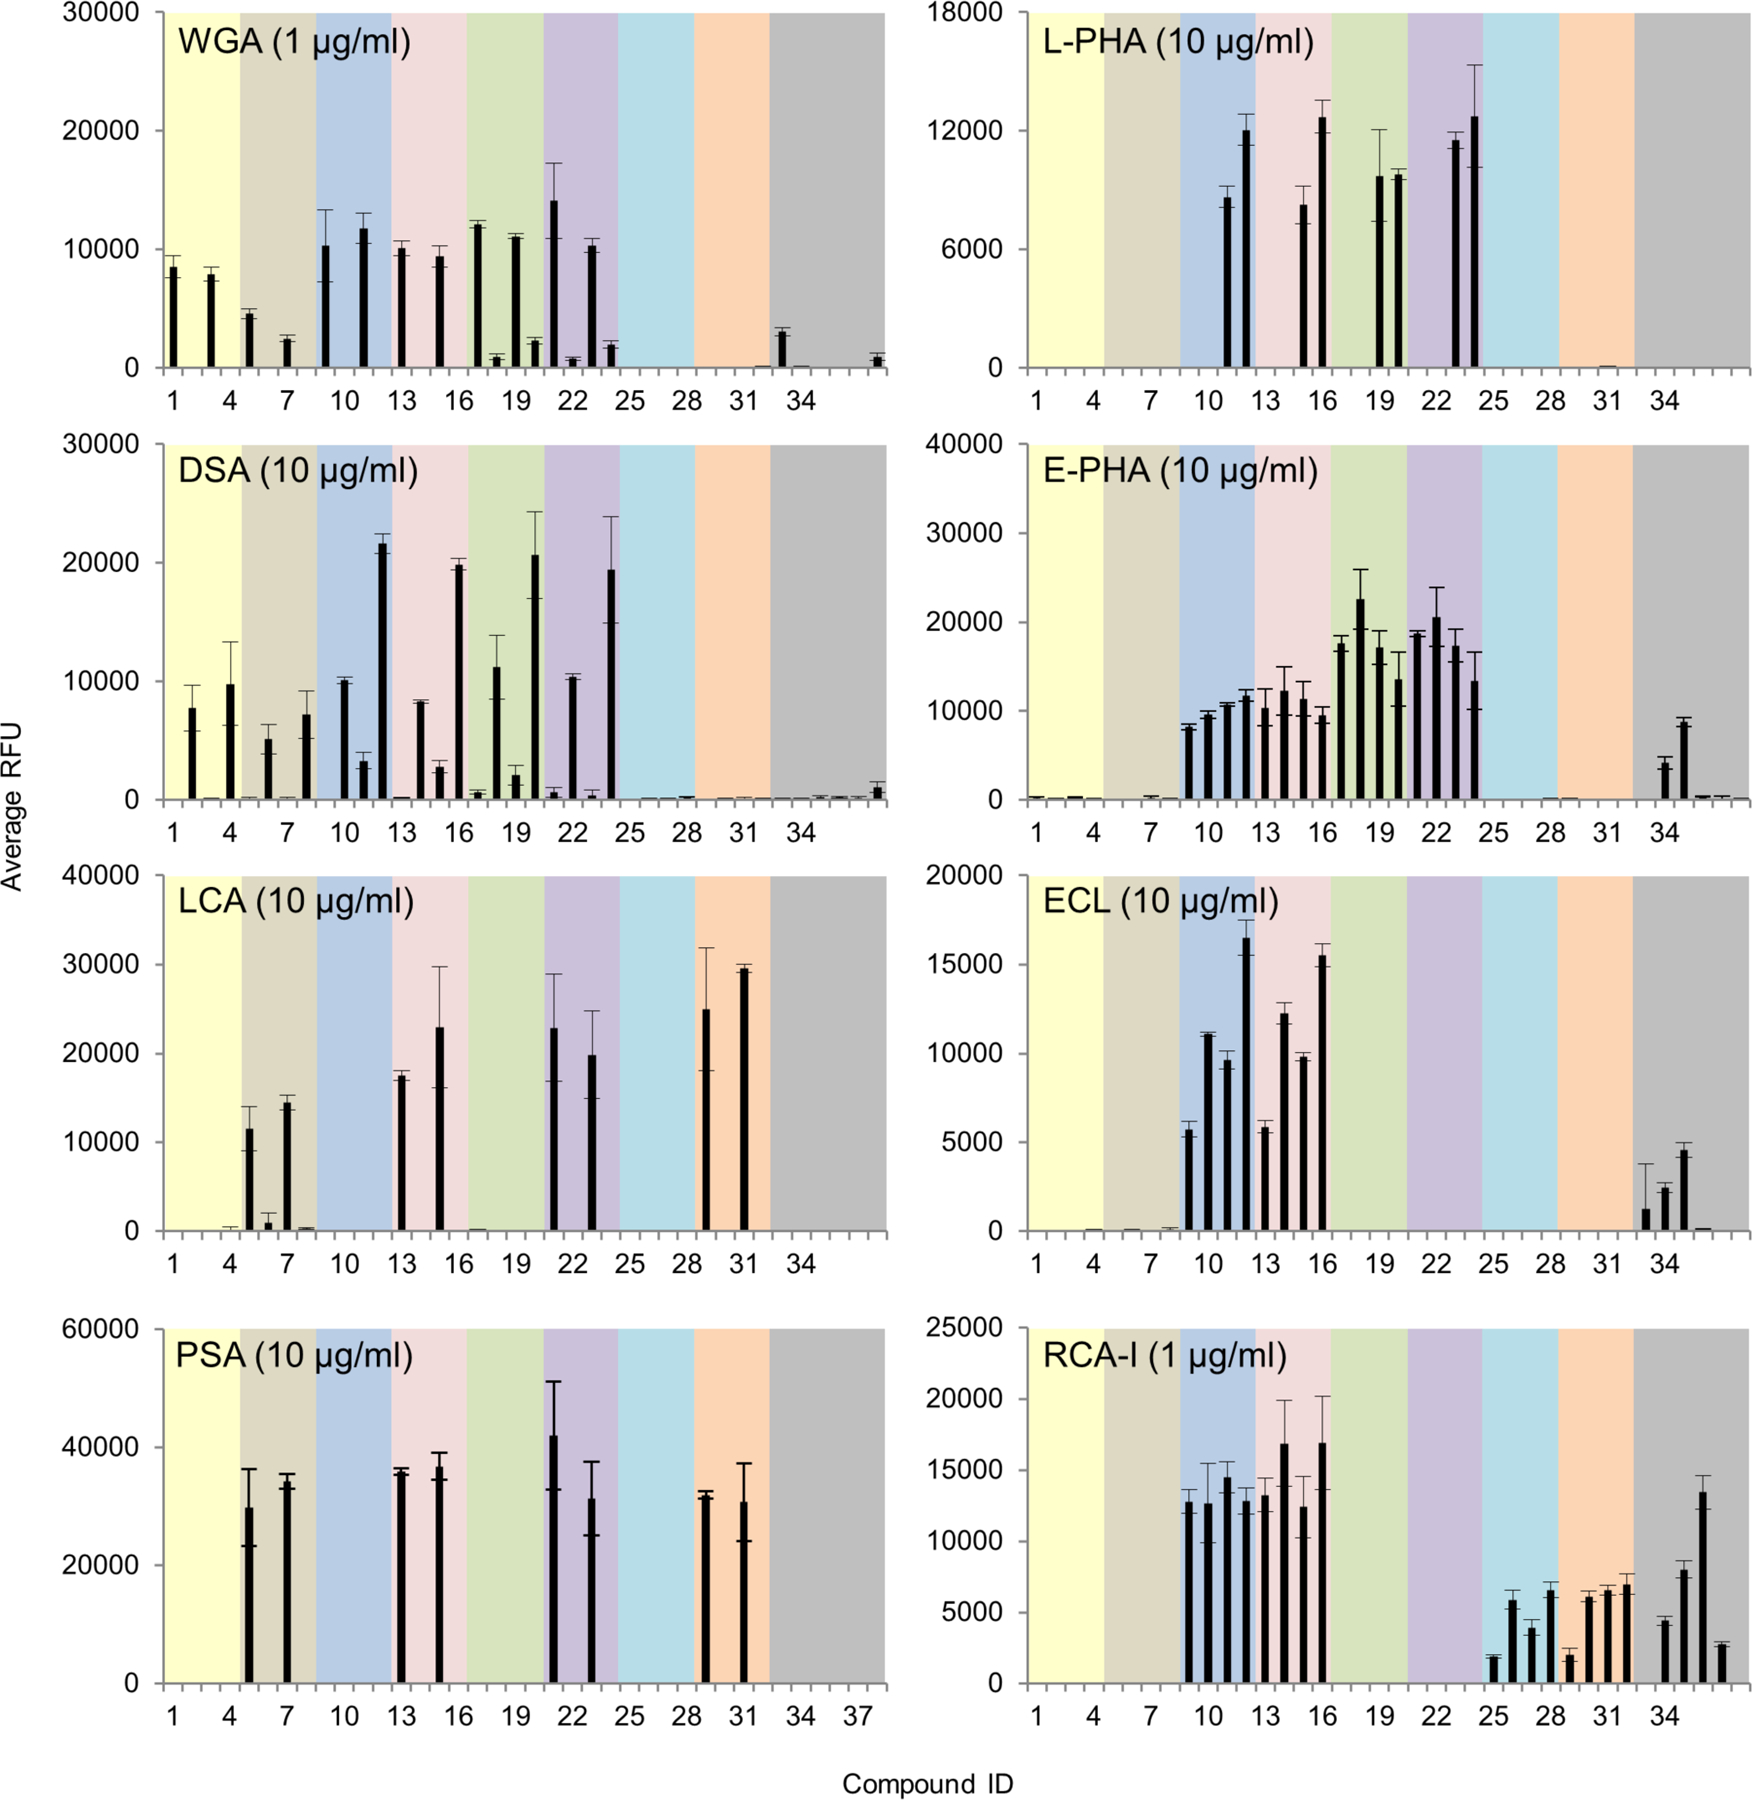
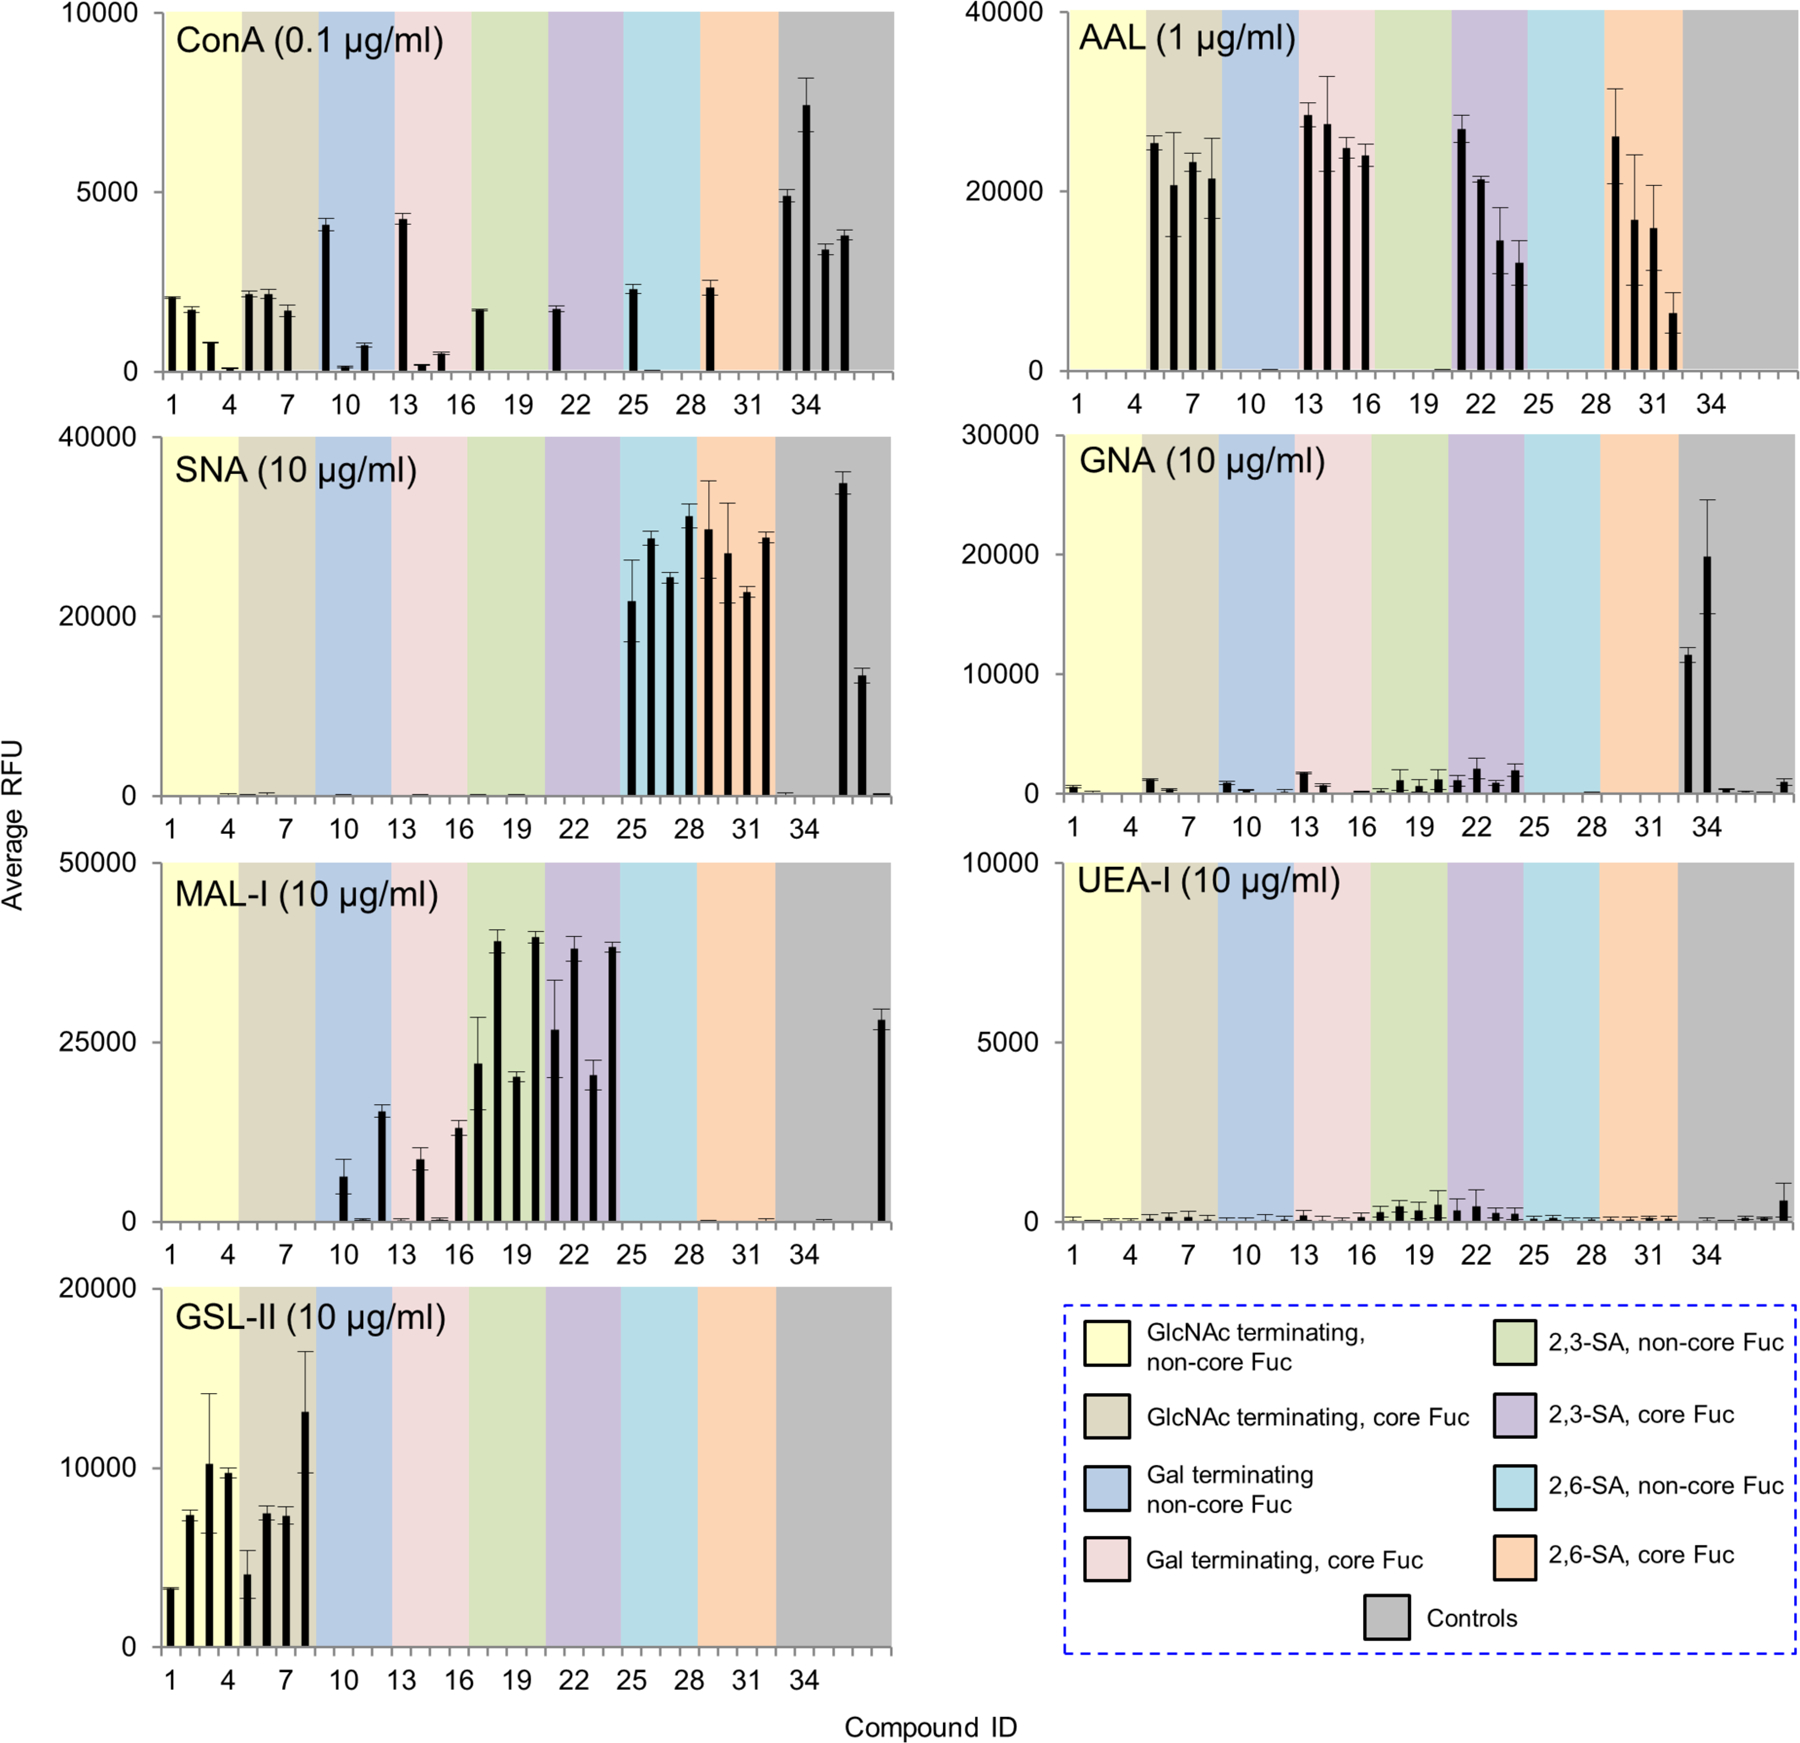
Microarray analyses of sequence-specific lectins using the newly prepared N-glycan array. Results are shown as relative fluorescence units (RFUs) by averaging the background-subtracted fluorescence signals of 4 replicate spots, error bars represent the standard deviation among the 4 values. The RFUs and the standard deviation were listed in Supplemental Table S2. These lectins shown here were also tested at a higher concentration and the data were shown in Supplemental Fig. S2. The probes are numbered as shown in Fig. 1 and grouped as indicated in the colored panels.