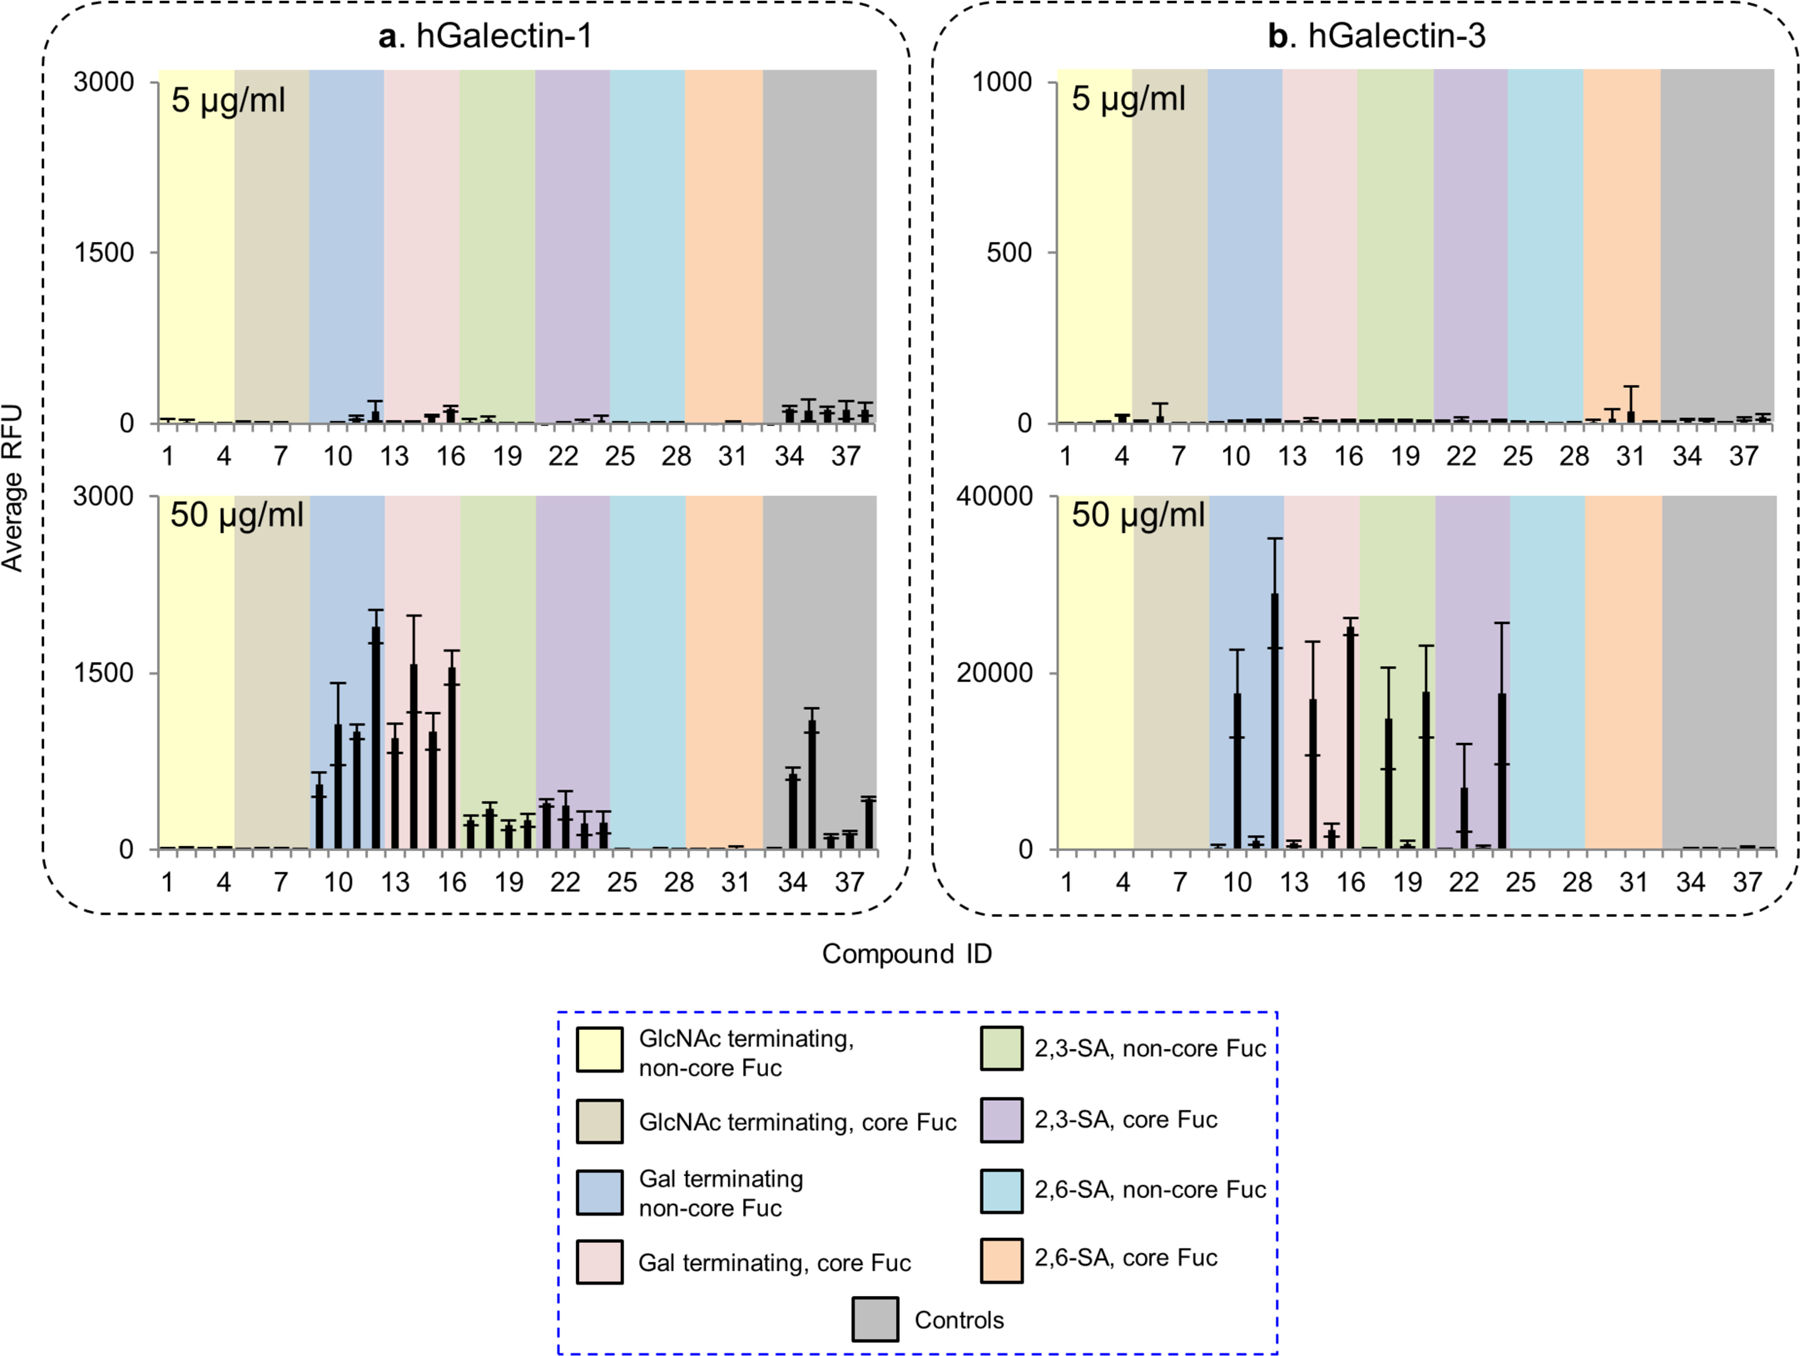
Figure 5.

Microarray analyses of recombinant human galectin-1 and -3. (a) and (b), The recombinant galectin-1 and -3 were tested at 5 and 50 μg/mL. Galectin-1 was detected by mouse anti-human galecin-1 followed by Alexa Fluor 488 labelled anti-mouse IgG (H+L). Galectin-3 was directly labelled with biotin and detected by cyanine 5-streptavidin. Results are shown as relative fluorescence units (RFUs) by averaging the background-subtracted fluorescence signals of 4 replicate spots, error bars represent the standard deviation among the 4 values. The RFUs and the standard deviation of 50 μg/mL were listed in Supplemental Table S2. The probes are grouped as indicated in the colored panels.
