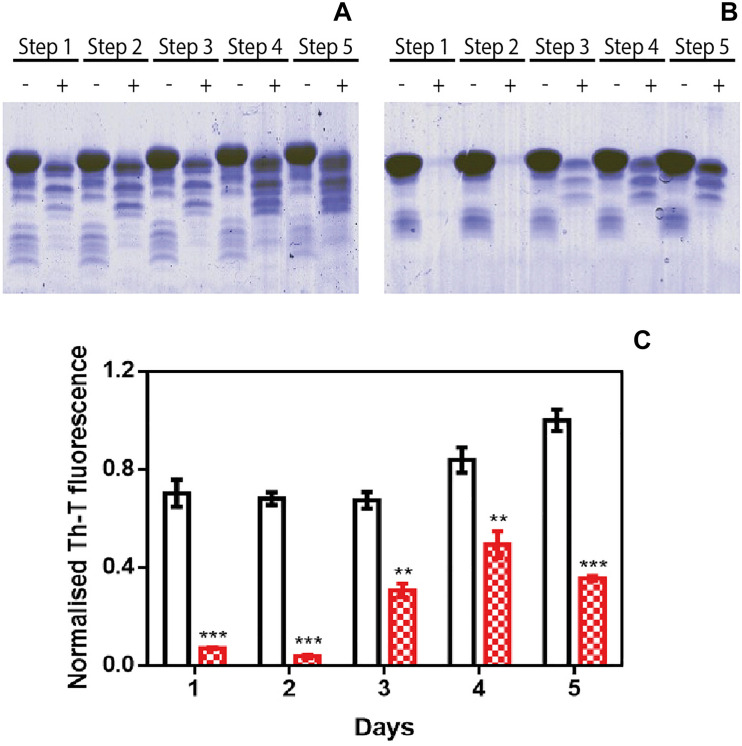
FIGURE 3.
Inhibitory activity of ZPDm in PMCA assays. (A,B) Bis/Tris SDS-PAGE gels of PMCA samples in the absence (A) and presence (B) of ZPDm, before (–) and after (+) PK digestion. (C) Th-T fluorescence of different PMCA cycles in samples treated (red) and untreated (white) with ZPDm. Th-T fluorescence is plotted as normalized means. Error bars are represented as SE of mean values; ∗∗p < 0.01 and ∗∗∗p < 0.001. ZPDm anti-aggregation activity results in delayed formation of PK-resistant and Th-T positive amyloid structures.

