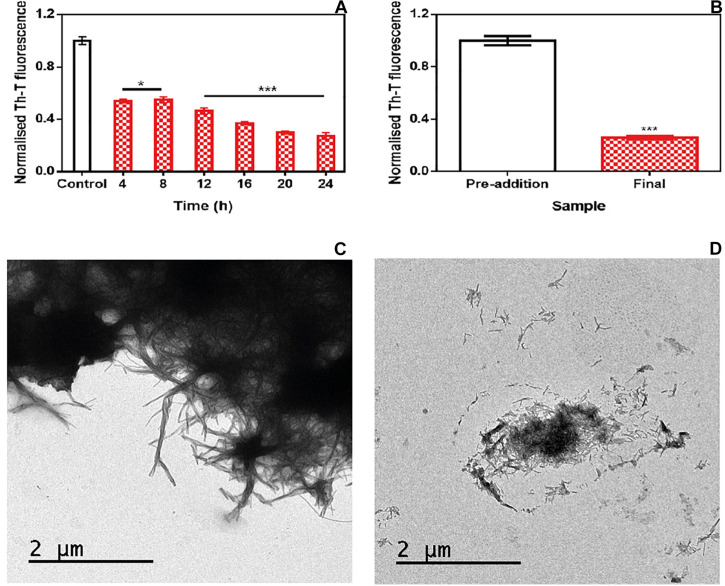
FIGURE 4.
Disaggregational activity of ZPDm. (A) Th-T fluorescence of α-Syn end-point aggregates after the addition of ZPDm at different time points during the aggregation kinetics. (B) Th-T fluorescence assay before and 24 h after the addition of ZPDm to mature α-Syn fibrils. (C,D) Representative TEM images in the absence (C) and presence (D) of ZPDm. Th-T fluorescence is plotted as normalized means. Error bars are represented as SE of mean values; *p < 0.05 and ***p < 0.001. ZPDm inhibitory capacity increases with the reaction progress, indicating that the compound may interact with aggregated structures and disentangle them.

