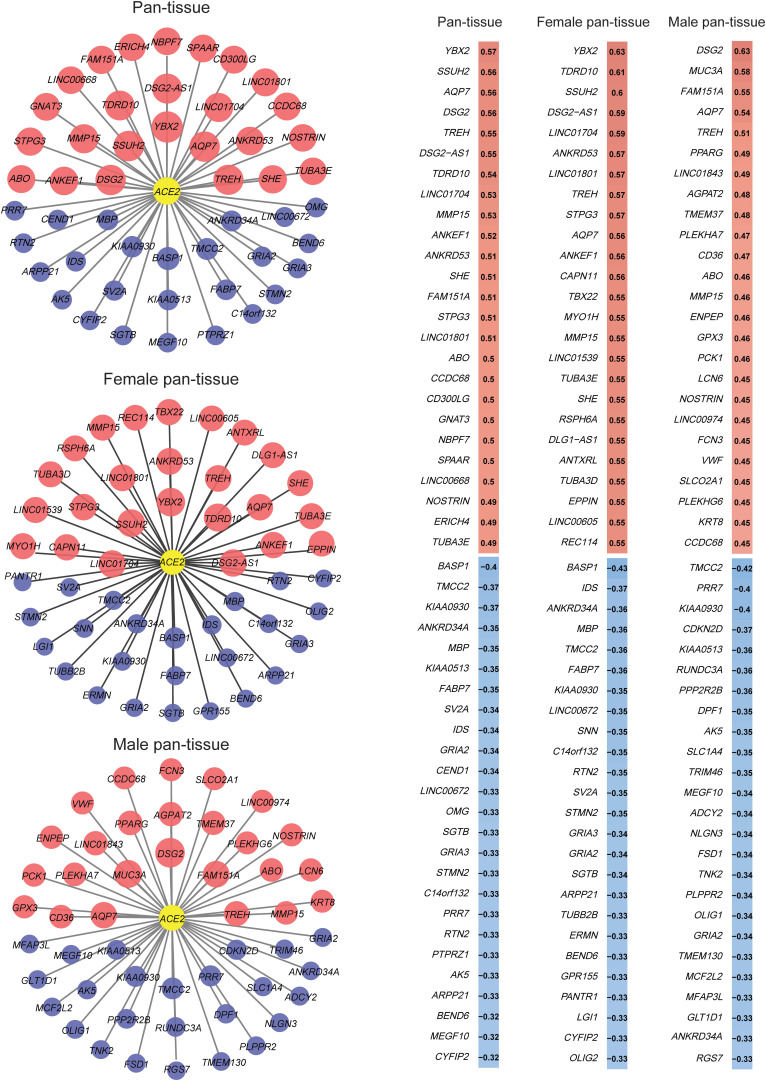
FIGURE 2.
25 genes having the strongest positive and negative expression correlation with ACE2 in pan-tissue, female pan-tissue, and male pan-tissue. The expression correlation analysis was performed by Pearson’s correlation test, and the gene co-expression networks were generated by Cytoscape (Shannon et al., 2003). The red nodes indicated positive expression associations between the genes and ACE2, and the blue nodes indicated negative expression associations. The size of the nodes is proportional to the correlation coefficient.

