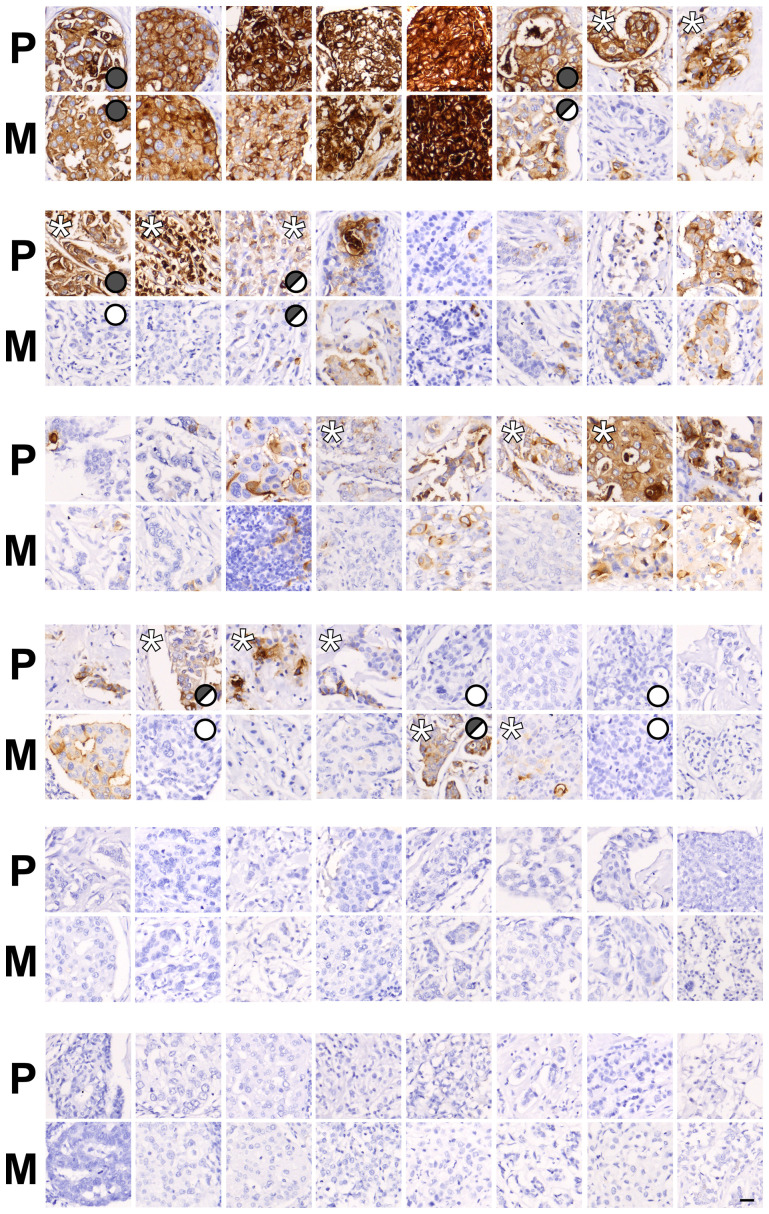
Figure 3. Pairs of primary breast cancer and lymph node metastases demonstrate different patterns of CEACAM5 expression.
Immunohistochemical stainings for CEACAM5 on paired primary breast cancers (P) and corresponding lymph node metastases (M) from a tissue microarray (TMA). Tumor pairs are ordered according to expression patterns marked by symbols: homogeneous expression (filled grey circle), heterogeneous expression (half-filled grey circle) and no expression (white circle). *marks tumors with a notably higher frequency of CEACAM5-positive cells within a pair. Bar, 25 μm.

