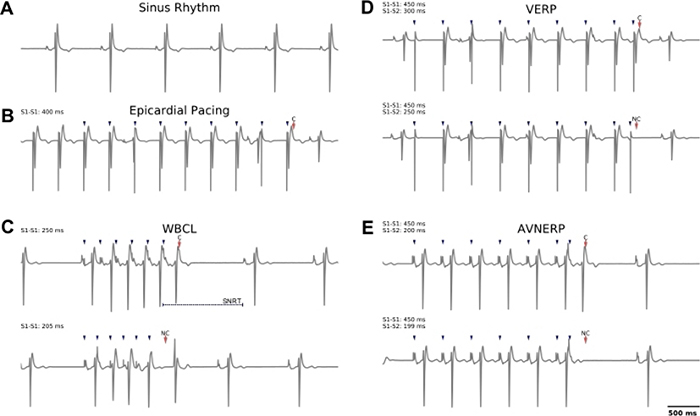
Figure 3: Representative examples of lead II electrocardiogram recordings collected during sinus rhythm or in response to external pacing.
(A) Normal sinus rhythm. (B) Example of epicardial pacing at cycle length of 400 ms (S1−S1), which was used for imaging experiments. (C) Top: Atrial pacing to identify WBCL; successful capture is observed at S1 = 250 ms wherein atrial to ventricular conduction is observed. Note that atrial pacing can be used to determine SNRT (time to sinus node discharge, after commencing external pacing). Bottom: As the S1 cycle length is decreased to 205 ms, the conduction to the ventricle fails. (D) Top: Epicardial pacing (S1−S2) to identify VERP; successful capture is observed at S1 = 450 ms, S2 = 300 ms. Bottom: As the S2 cycle length is decreased to 250 ms, the ventricular tissue fails to capture. (E) Atrial pacing (S1−S2) to identify AVNERP. Top: Successful capture is observed at S1 = 450 ms, S2 = 200 ms. Bottom: As the S2 cycle length is decreased to 199 ms, conduction to the ventricle fails. Blue arrows denote pacing spikes, red arrows denote capture (‘C’) or no capture (‘NC’). S1−S1 = dynamic pacing, S1−S2 = extrastimulus pacing.

