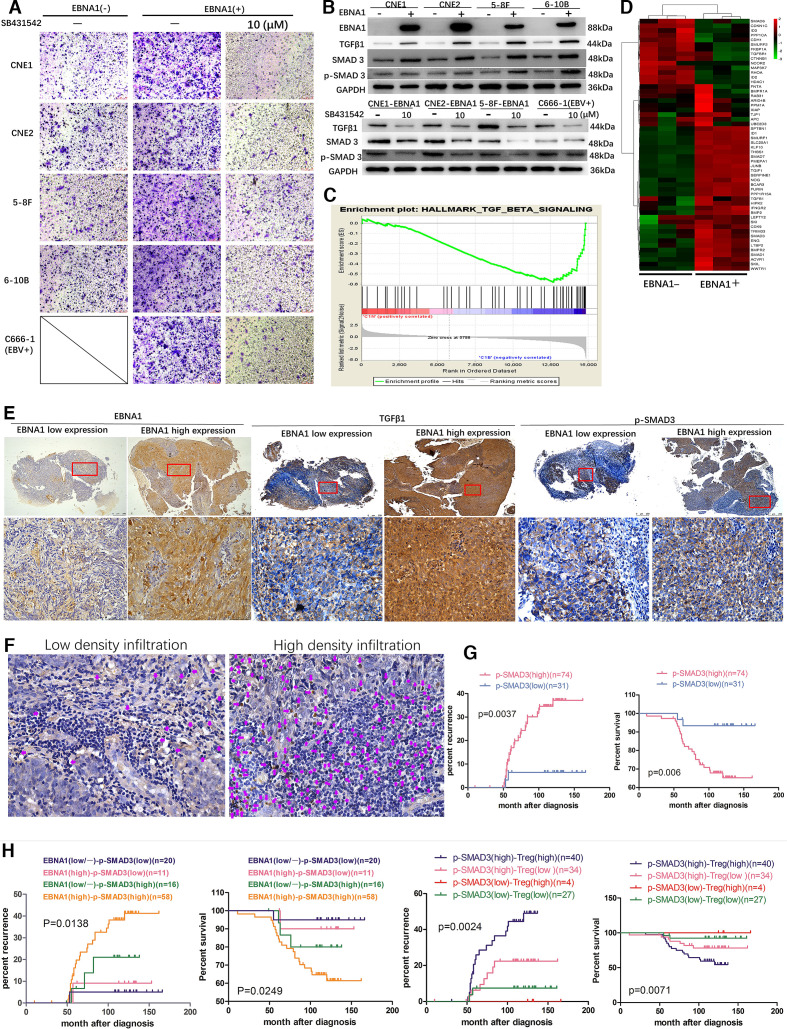
Figure 1.
EBV-EBNA1 promotes migration of Treg cells by activating TGFβ1-SMAD3 signaling. (A) SB431542 blocked the migration of Treg cells induced by EBNA1. (B) Upper: TGFβ1, SMAD3 and p- SMAD3 protein expression in EBNA1-positive and -negative NPC cell lines assayed by western blot (WB). Lower: SB431542 blocked the expression of TGFβ1, SMAD3 and p-SMAD3 induced by EBNA1. (C) TGFβ signaling is enriched in EBNA1-positive group in the hallmark gene sets database according to GSEA. (D) Differentially expressed genes in EBNA1-negative and -positive cells in TGFβ signaling according to hierarchical clustering analysis. (E) Representative EBNA1, TGFβ1 and p-SMAD3 expression in NPC patients in the EBNA1 low and high expression groups according to IHC detection. Scale bars at the bottom right: 500 μm (low magnification) and 75 μm (high magnification). (F) Representative images of tumor-infiltrating Treg cells according to FOXP3 staining. The purple arrows represent FOXP3+ Treg cells in the stroma surrounding the tumor cells. Scale bars at the bottom right: 75 μm. (G) Kaplan-Meier analysis of recurrence risk and overall survival for p-SMAD3 expression groups in 105 NPC patients. (H) Kaplan-Meier analysis of recurrence risk and overall survival for concurrent EBNA1/p-SMAD3 expression groups or concurrent p-SMAD3/Treg pathological feature groups in 105 NPC patients. EBV, Epstein-Barr virus; GSEA, Gene set enrichment analysis; TGFβ, transforming growth factor-β; Treg, regulatory T; IHC, Immunohistochemistry.

