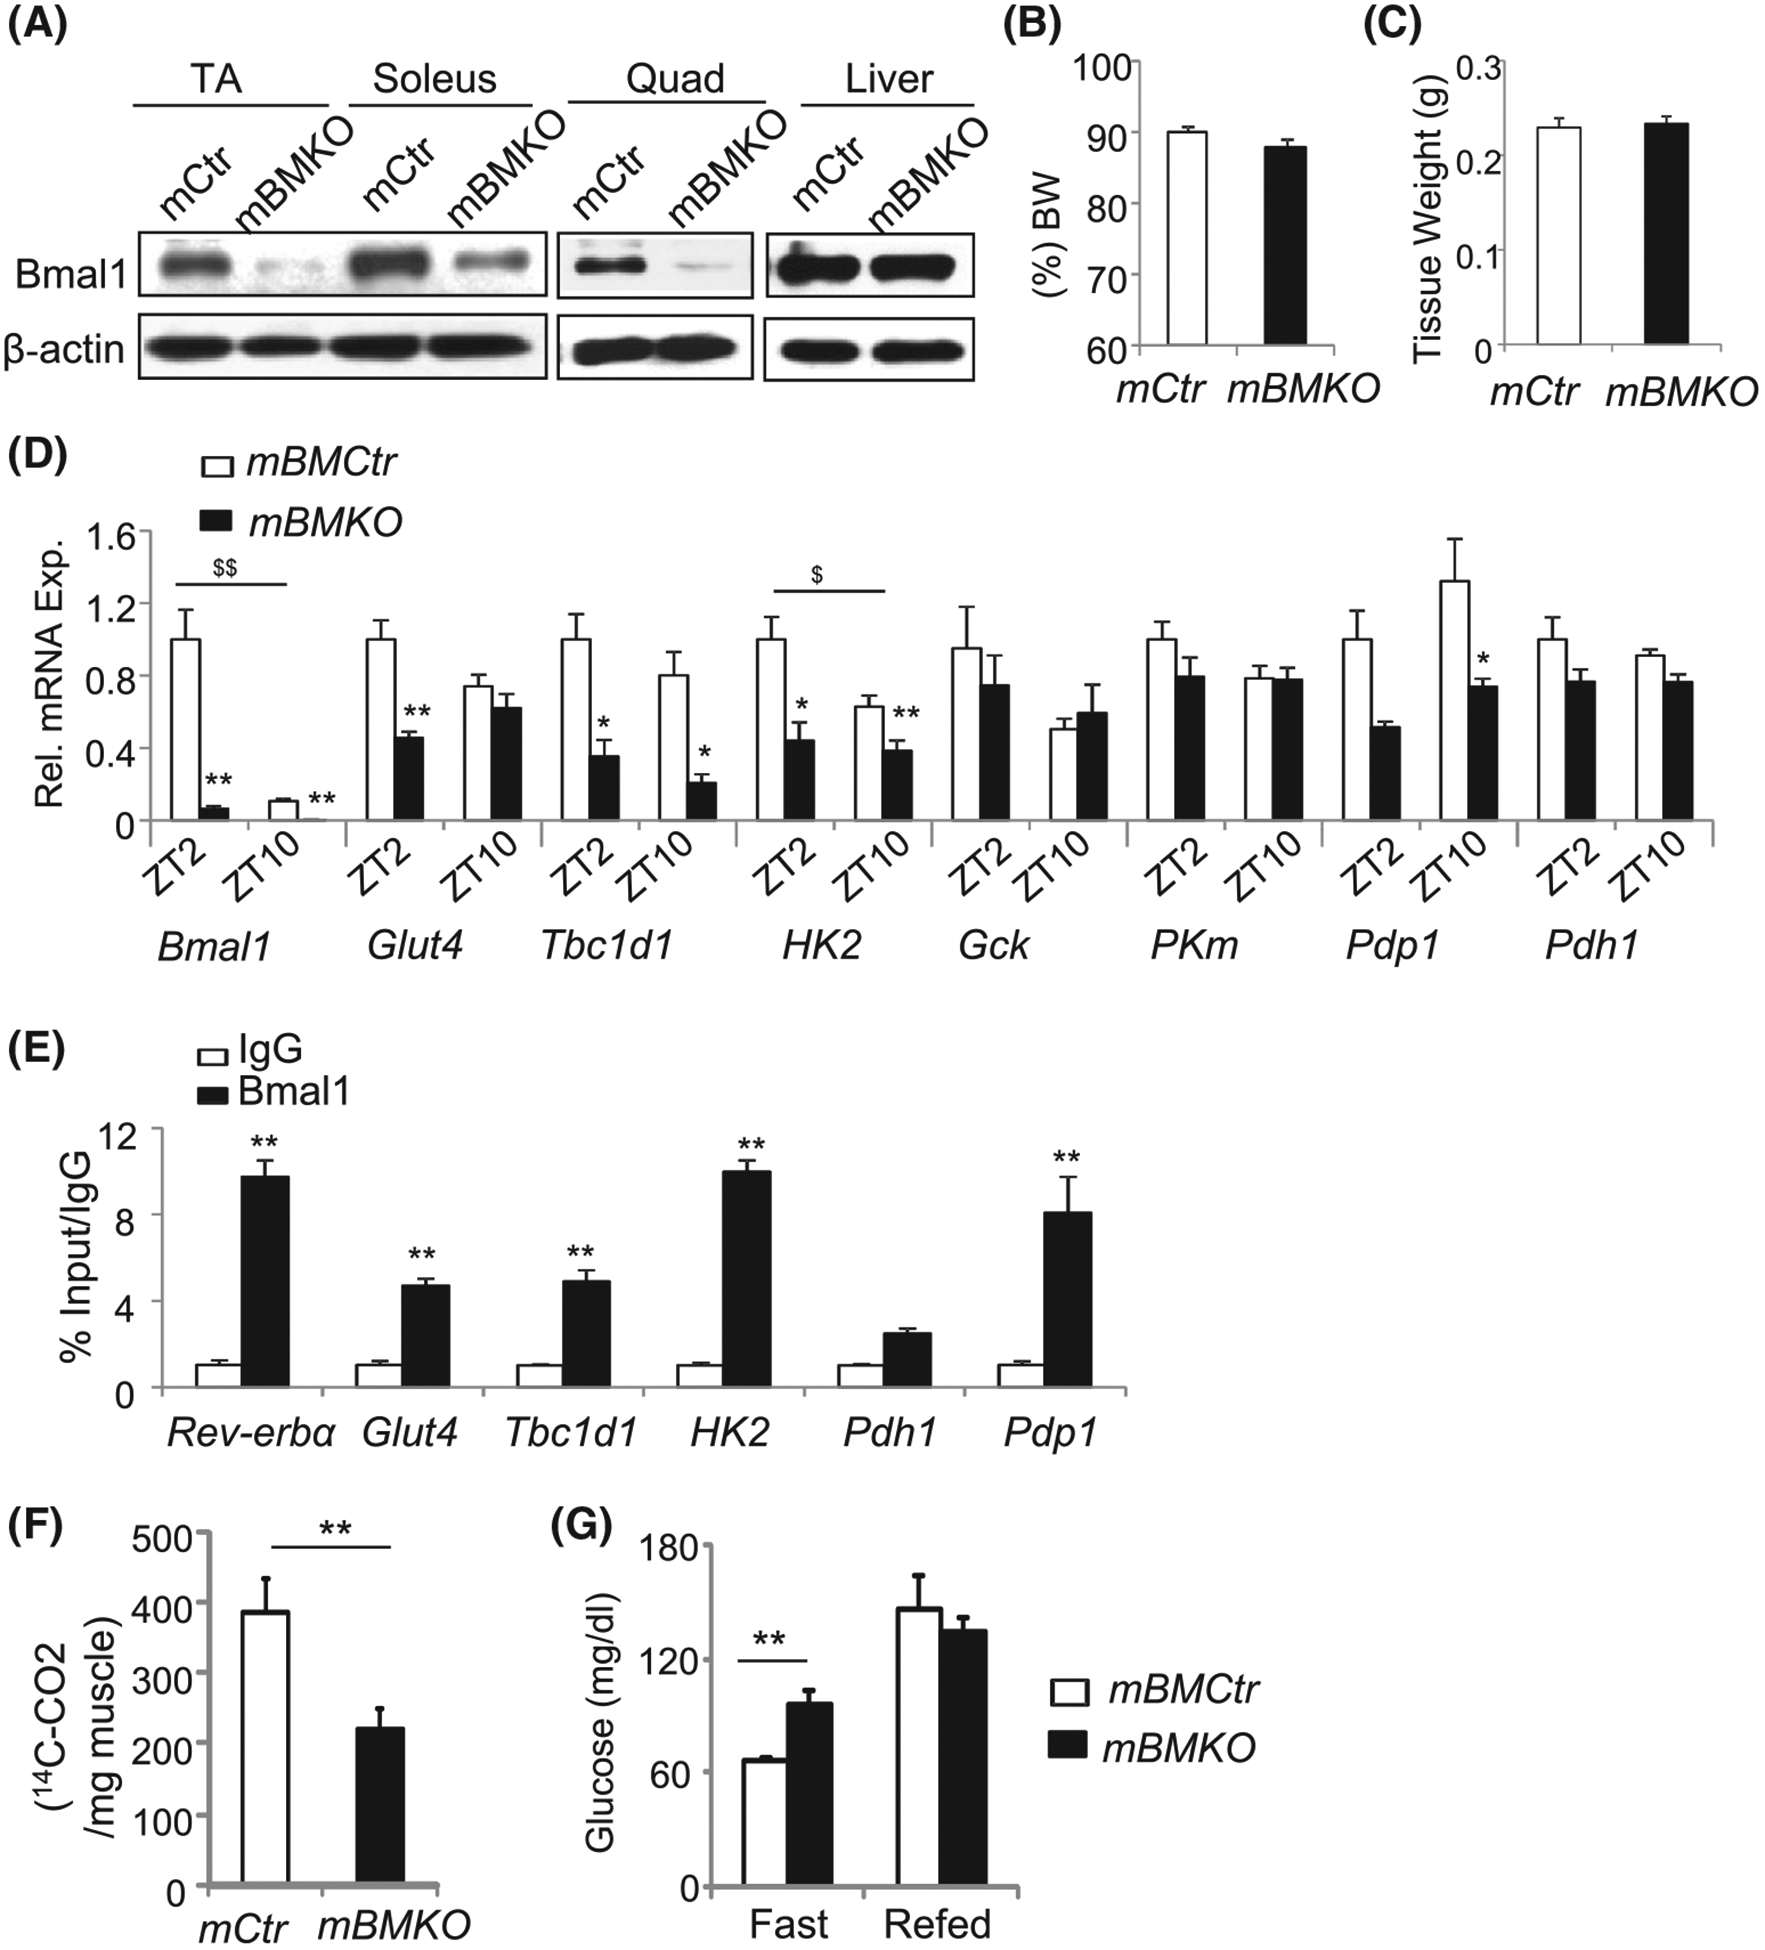
FIGURE 2.

Regulation of muscle Bmal1 on glucose metabolism. A, Bmal1 ablation in muscle but not the liver in the mBMKO mice. Pooled samples (n = 4–5 mice/group) were collected at ZT2. B and C, NMR analysis of lean muscle mass content (B), and isolated gastrocnemius (GN) muscle tissue weight (C) in 12-week-old control and mBMKO mice (n = 7 mCtr and n = 8 mBMKO). D, RT-qPCR analysis of glucose metabolic pathway gene expression in TA of control and mBMKO mice (N = 5–6). *,**P < .05 or .01 mBMKO vs mBMCtr, $,$ $P < .05 or .01 ZT2 vs ZT10 by two-way ANOVA. E, ChIP-qPCR analysis of Bmal1 chromatin occupancy of the E-box element in the regulatory regions of glucose metabolic genes in C2C12 differentiated myotube (n = 4). The fold of enrichment is expressed as a percent of 1% input normalized to IgG. F, Glucose oxidation rate as measured in soleus muscle of control and mBMKO mice using C-14 glucose under insulin-stimulated condition. n = 6/group. G, Plasma glucose levels under fasting or refed state in control and mBMKO mice (n = 7 mBMCtr and n = 9 mBMKO)
