
FIGURE 3.
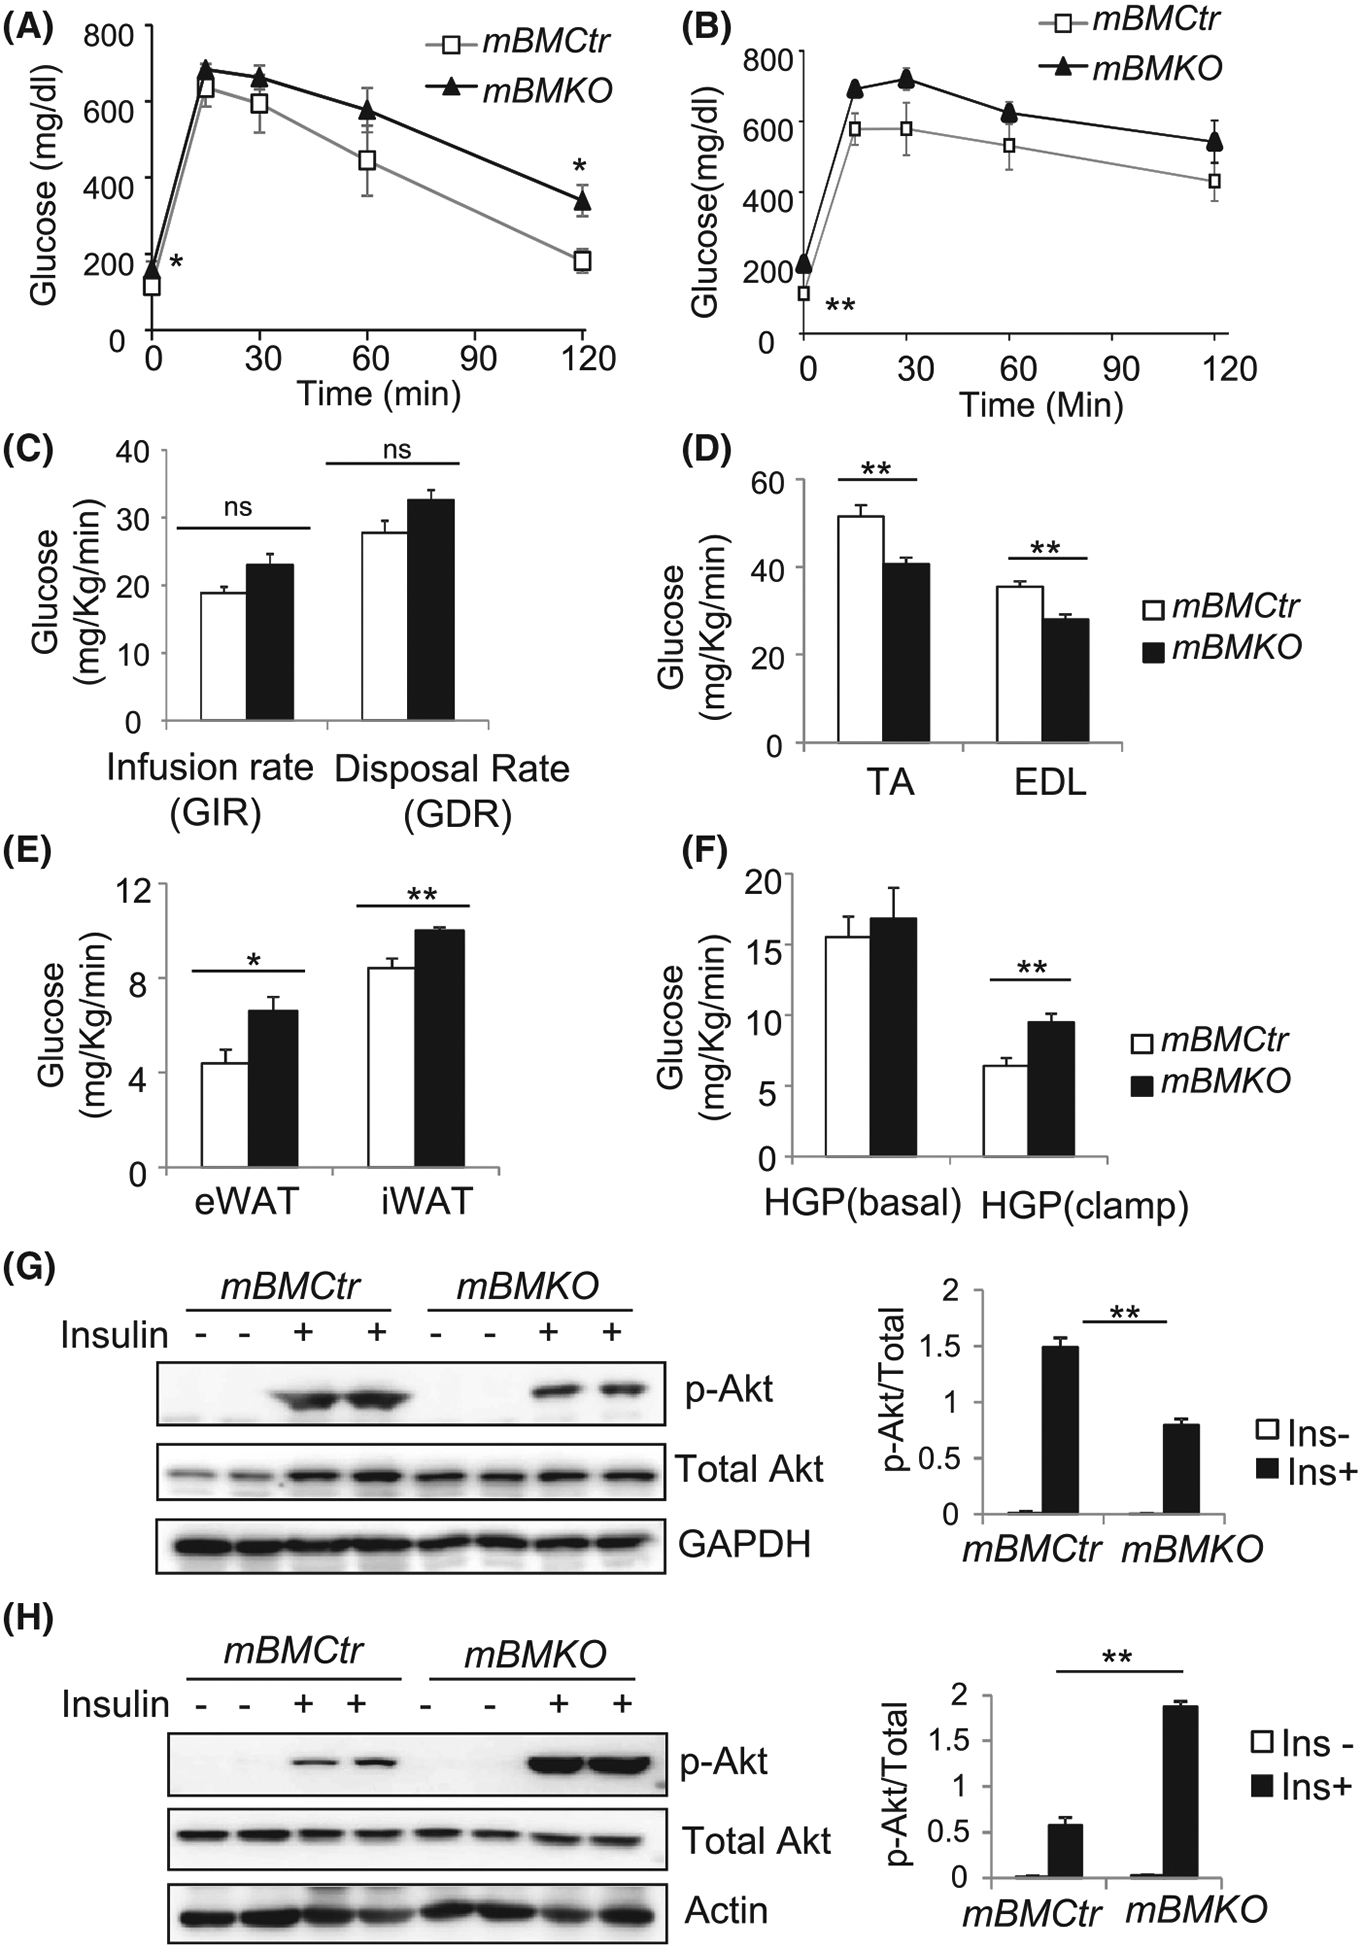
Glucose homeostasis in mice with muscle Bmal1 ablation. A and B, Glucose level during the IP glucose tolerance test of mice on regular chow diet (A), or after 12 weeks of 45% high-fat diet (B) in mBMKO (n = 9) vs mBMCtr (n = 10) mice. C-F, Low-dose hyperinsulinemic-euglycemic clamp study in regular chow-fed 12-weeks old mBMKO vs mBMCtr mice (n = 6/group). Steady-state glucose infusion rate and disposal rate (C), glucose uptake in TA and extensor digitalis longus (EDL) muscle (D), glucose uptake in visceral epididymal white adipose tissue (eWAT) and inguinal subcutaneous white adipose tissue (iWAT) (E), and hepatic glucose production under basal and low-dose clamp condition (F). *, **P < .05 or .01 mBMKO vs mBMCtr by unpaired Student’s t test. G and H, Insulin signaling activity in skeletal muscle (G) and eWAT (H) as assessed by immunoblot of Akt phosphorylation 20 minutes after IP insulin injection (5 mg/Kg). Pooled protein samples of n = 3/lane