
FIGURE 4.
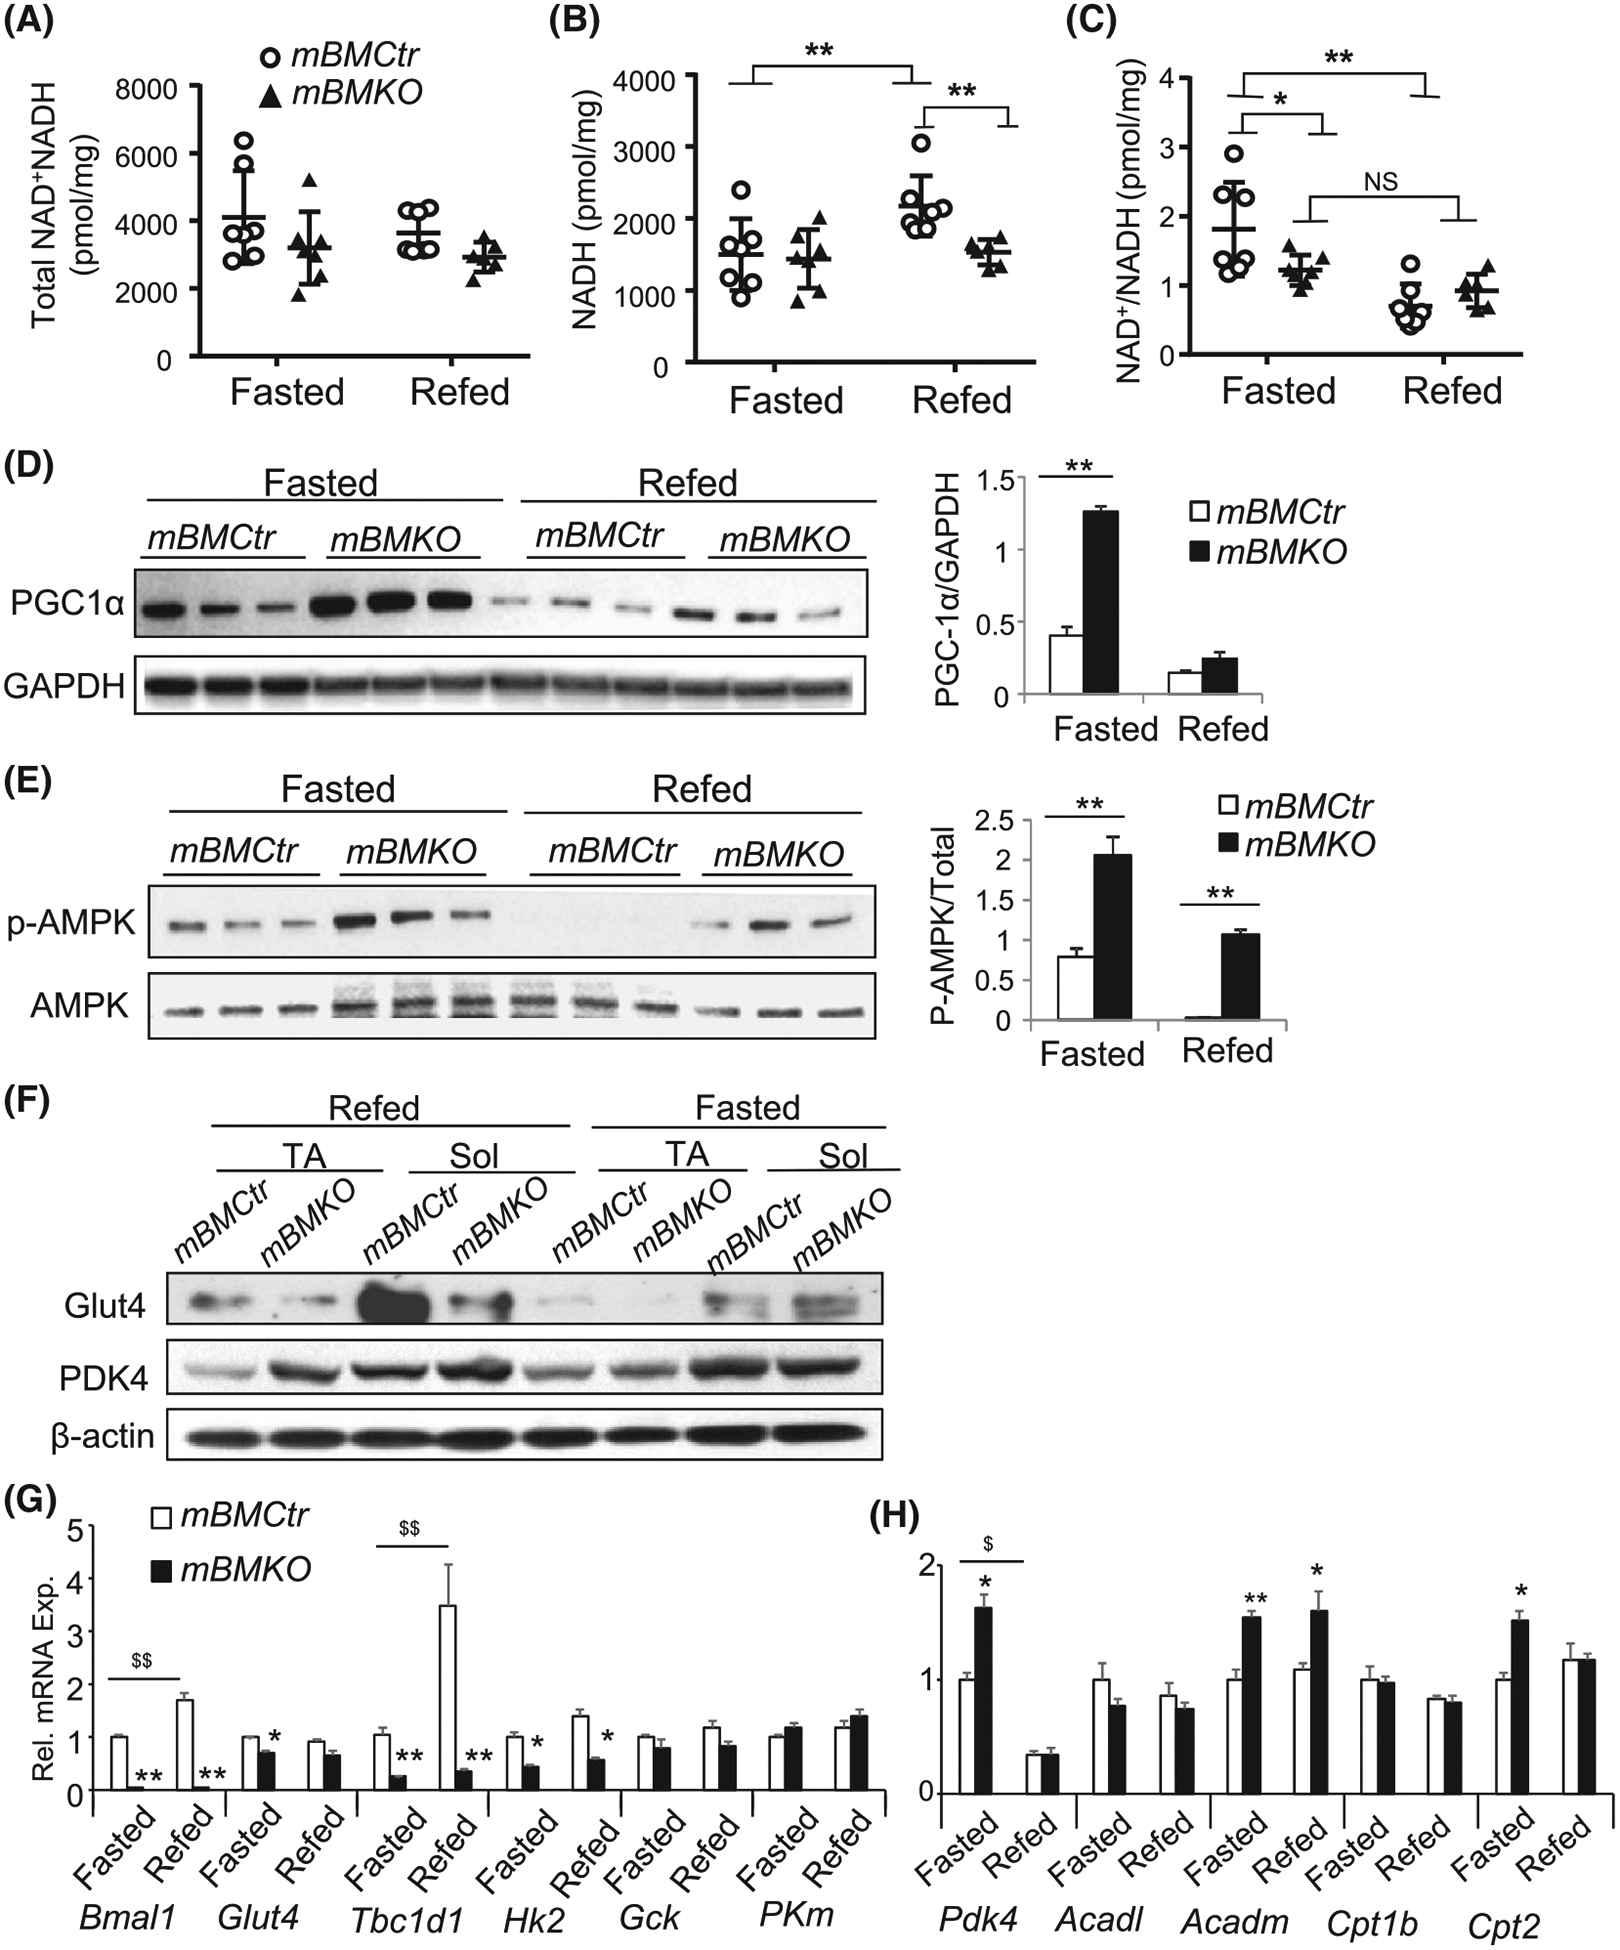
Activation of energy-sensing signaling pathways and impaired fasting-to-feeding metabolic transition in Bmal1-deficient muscle. A-C, Skeletal muscle total NAD++NADH (A), NADH levels (B) and NAD+/NADH ratio (C) in TA muscle of mBMCtr and mBMKO mice in response to feeding and fasting (n = 6–7/group). D and E, Immunoblot analysis of PGC-1a protein expression (D), and AMPK phosphorylation (E) under fasting or refeeding conditions in mBMCtr and mBMKO mice (n = 3/group). F, Immunoblot analysis of Glut4 and PDK4 protein regulations, and (G, H) RT-qPCR analysis of genes involved in fat oxidation (G) and glucose metabolism (H) in response to fasting and refeeding in mBMCtr (n = 6) and mBMKO (n = 5) mice. *,**P < .05 or .01 mBMKO vs mBMCtr; $,$ $P < .05 & .01 fasted vs refed by two-way ANOVA