
FIGURE 5.
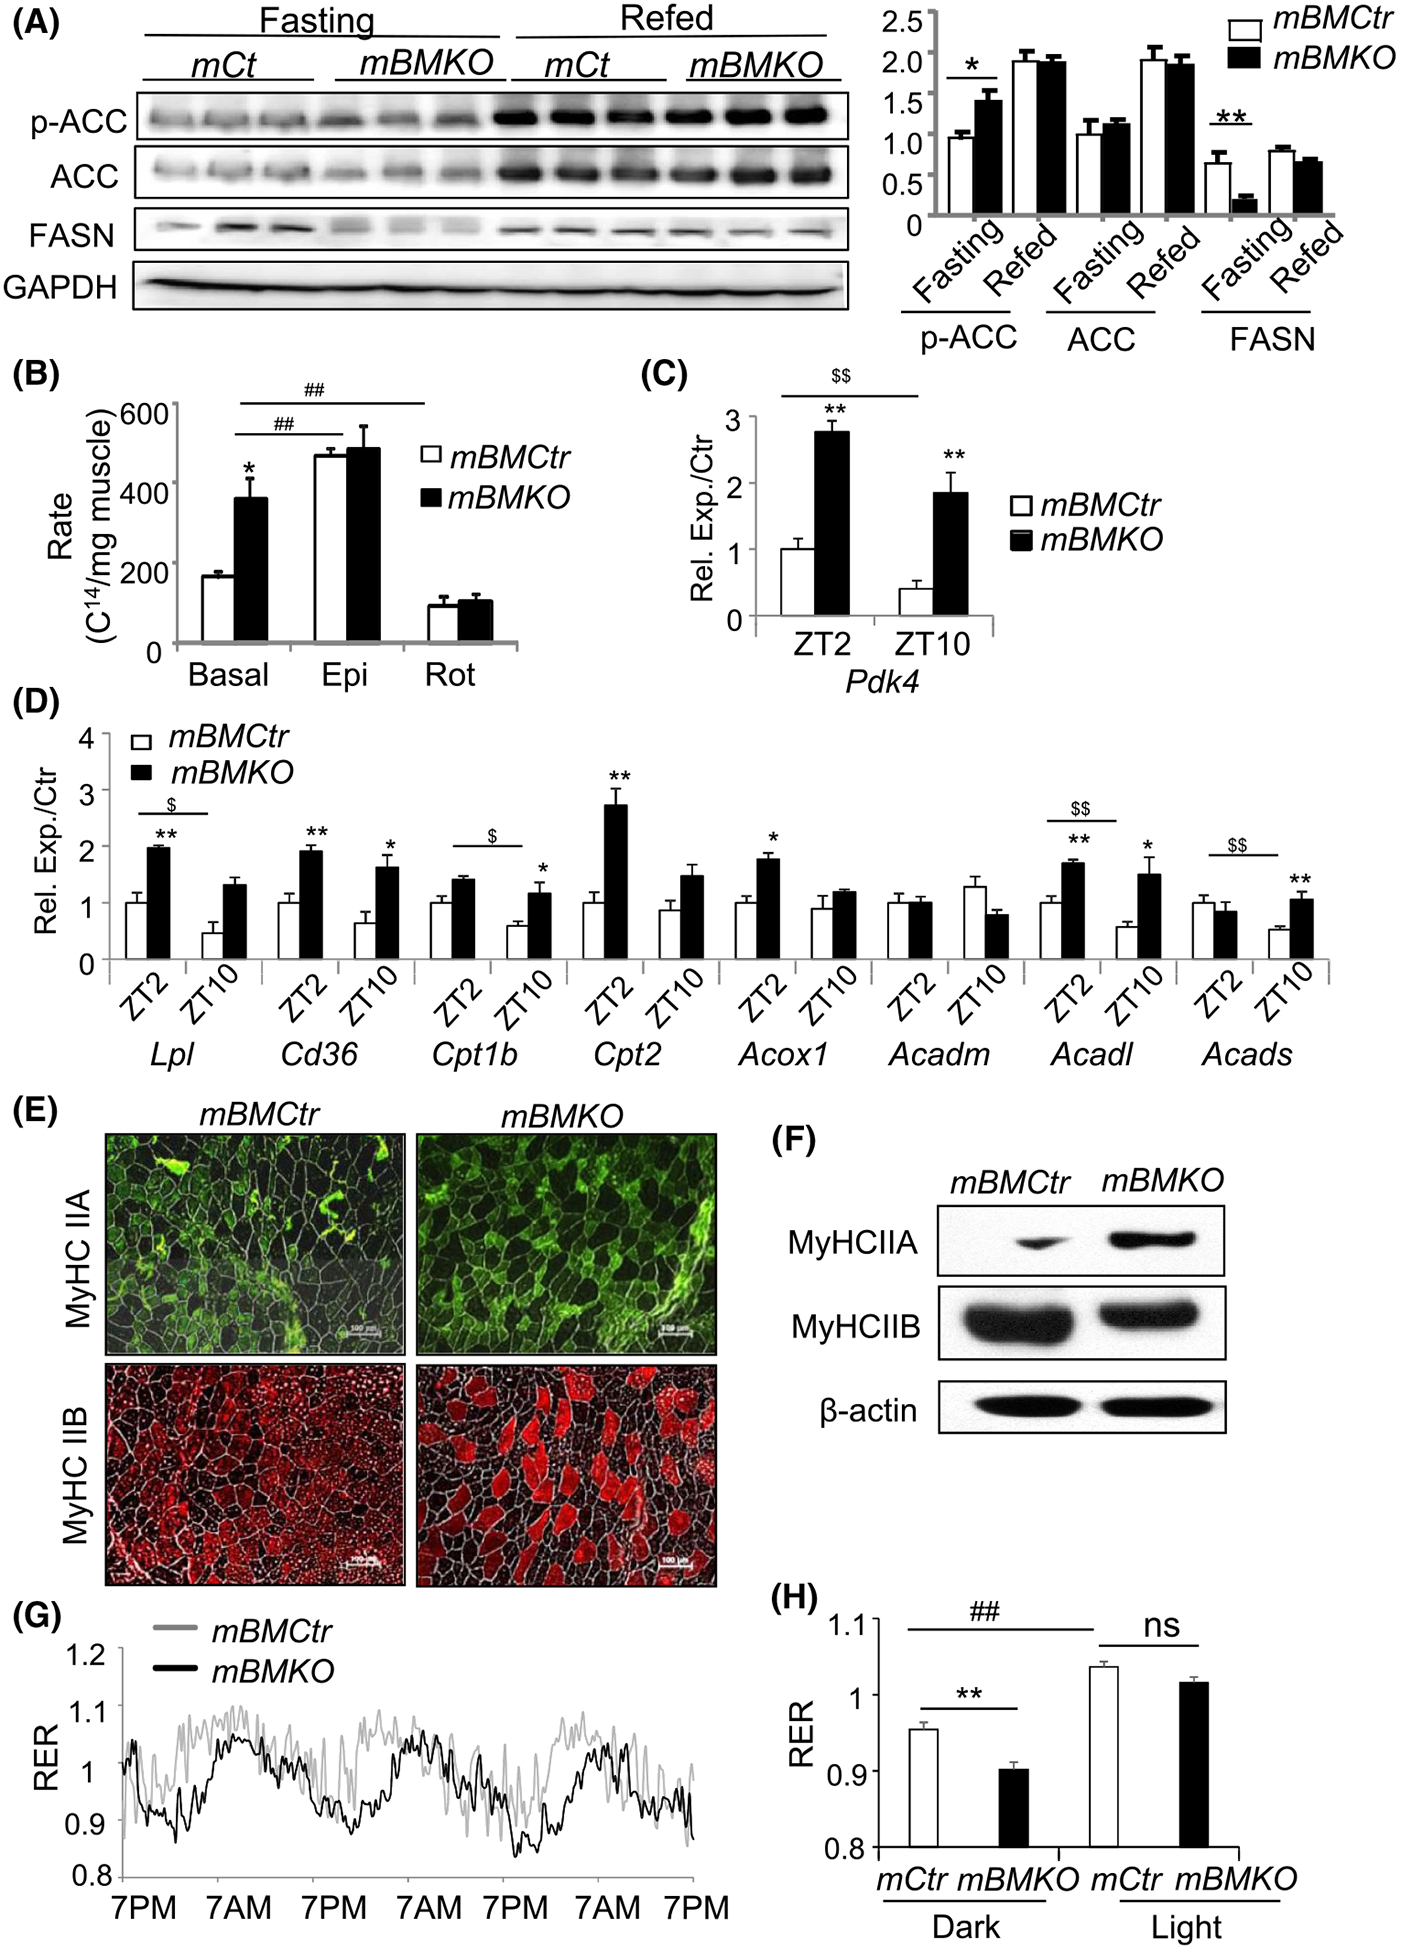
Enhanced fatty acid metabolism in Bmal1-deficinet muscle. A, Immunoblot analysis of phosphorylation of acetyl-coA carboxylase (ACC) and fatty acid synthetase (FASN) protein expression in fasting and refed mBMCtr and mBMKO mice (n = 3/group). B, Ex vivo fatty acid β-oxidation rate of soleus muscle using C14-palmitic acid substrate under basal non-stimulated, epinephrin-stimulated states and rotenone inhibition (n = 6/group). **P < .01 mBMKO vs mBMCtr; ##P < .05 & .01 treatment vs basal by two-way ANOVA. C and D, RT-qPCR analysis of Pdk4 and additional genes involved in lipid metabolism in TA muscle of mBMKO (n = 5) vs mBMCtr (n = 6) at ZT2 and ZT10. *,**P < .01 mBMKO vs mBMCtr; $,$ $P < .05 & .01 ZT2 vs ZT10 by ANOVA. E and F, Representative images of immunofluorescence staining of myosin heavy chain (MyHC) isoforms Type IIA and IIB fiber types (E), and immunoblot analysis (F) of pooled samples in TA of mBMCtr (n = 5) and mBMKO (n = 4) mice. G and H, Representative average tracing of 3-day respiratory exchange ratio (RER) monitoring by CLAMS calorimetry (G), and quantification of dark (9 PM-3 AM) and light period (9 AM-3 PM) (H) in mBMCtr and mBMKO mice (n = 6/group). **P < .01 mBMKO vs mBMCtr, and ##<.01 dark vs light period by unpaired Student’s t test