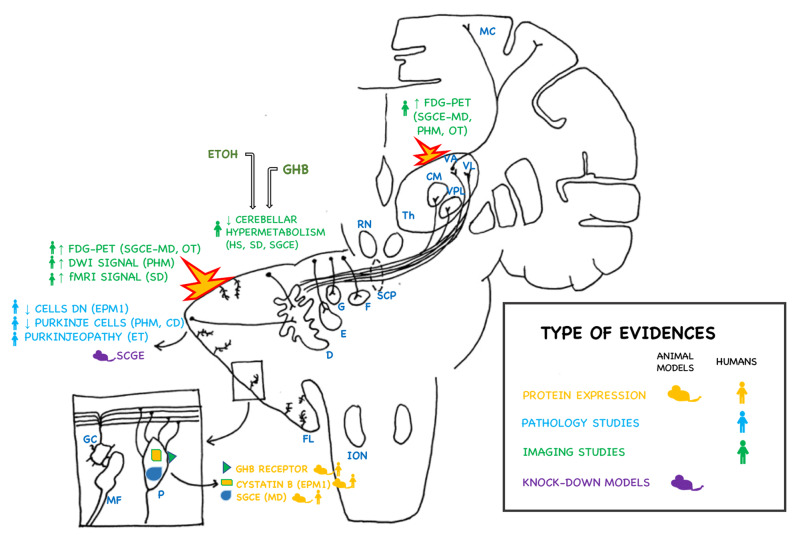
Figure 2.
Evidence supporting the hypothesis of the cerebellum and dentate nucleus in the pathogenesis of alcohol-responsive movement disorders. Evidence from imaging studies, neuropathology, animal models, and molecular evidences (such as protein expression) are captioned in the figure. The topographic distribution of involved brain regions and structures are shown in the scehematic representation of the cerebral and cerebellar hemispheres. The source of the evidence in human subjects (human silhouette) or in animal models (mouse cartoon) is also depicted. Different types of evidences are color coded (yellow: molecular studies – protein expression; light blue: pathology studies; green: imaging studies; purple: animal models). Activated areas (cerebellar cortex and thalamus) in these disorders are highlighted in the figure. ION: inferior olivary nucleus; FL: flocculonodular lobe; D: dentate nucleus; G: globose nucleus; E: emboliform nucleus; F: fastigial nucleus; SCP: superior cerebellar peduncle; RN: red nucleus; Th: thalamus; CM: centromedian nucleus; VPL: ventral posterolateral nucleus; VL: ventral lateral nucleus; MC: motor cortex; MD: myoclonus-dystonia; EPM1: Progressive myoclonic epilepsy type 1; ET: essential tremor; PHM: post-hypoxic myoclonus; CD: celiac disease; SD: spasmodic dysphonia; OT: orthostatic tremor; HS: healthy subjects; FDG-PET: fluoro-deoxy-glucose positron emission tomography. In the box in the left side corner: a schematic of magnification of the cellular structure of cerebellar cortex (P: Purkinje cell; MF: mossy fiber; GC: granular cells).

