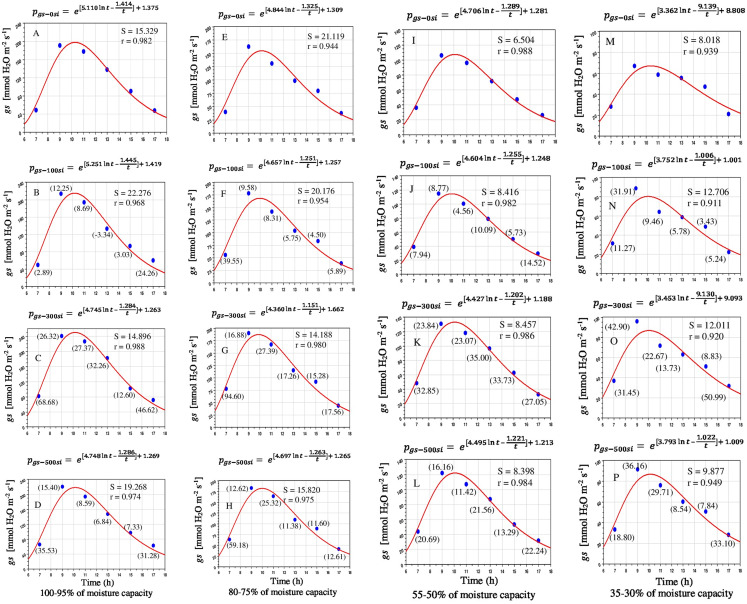
Figure 4. Diurnal variation of silicon on stomatal conductance in Saccharum officinarm “GT 42” plants under limited water supply such as 100–95% (A–D), 80–75% (E–H), 55–50% (I–L) and 35–30% of soil moisture capacity (M–P) with four levels of Si concentrations, for example, 0, 100, 300 and 500 mg L−1.
Parenthesis values indicate percentage gain against control condition.

