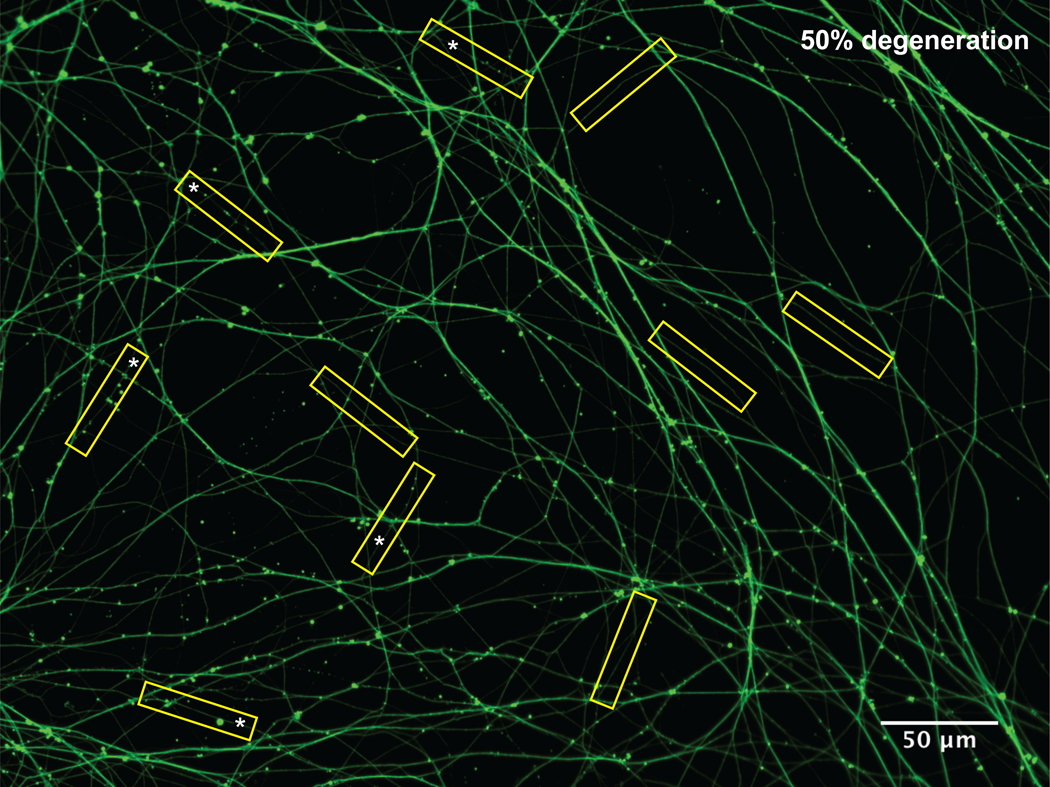
Figure 4: Quantification of axon degeneration.
P0 superior cervival ganglion neurons were cultured in microfluidics. At DIV 5, neurons were treated with global NGF deprivation for 19 hours, and then fixed and immunostained for Tuj1. 10 yellow 50 μm-long rectangular boxes were randomly assigned to signle axons in the image. Asterisks marked the degenerated axons. The percentage of degeneration in this field is 50%.

