Figure 3:
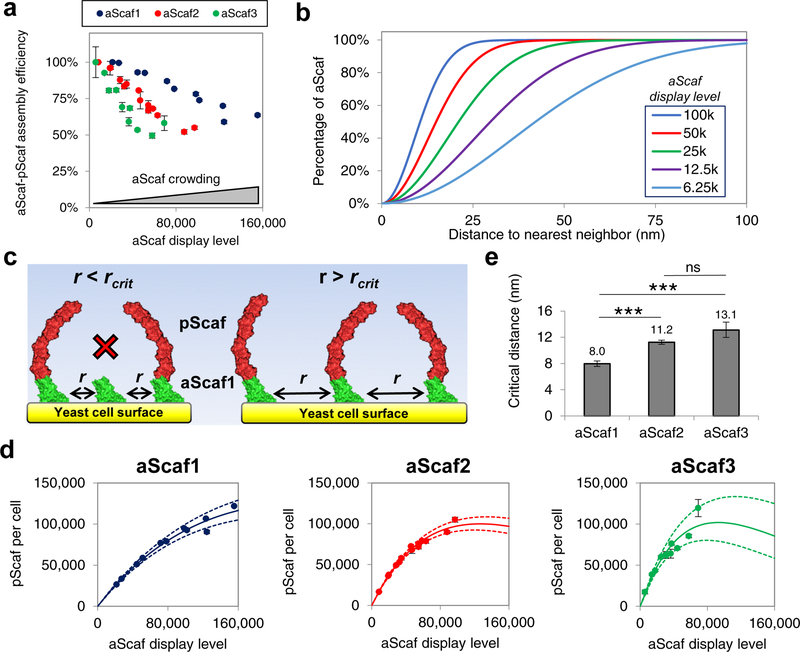
Modeling aScaf distribution and aScaf-pScaf assembly on yeast cell surface. (a) aScaf-pScaf assembly efficiency plotted as a function of aScaf display level (b) Theoretical random distribution representing the fraction of displayed aScaf plotted with respect to the distance to nearest neighbor for various aScaf display levels as calculated by Equation 2 (6.25k – 100k per cell). (c) Visual representation of aScaf-pScaf assembly inefficiency caused by aScaf surface crowding. pScaf-binding does not occur if the distance between neighboring aScafs (r) is less than the critical distance (rcrit). (d) pScaf assembly plotted with respect to the number of aScaf per cell. Solid line represents the theoretical pScaf assembly as a function of aScaf per cell based on surface crowding and rcrit values found using the random or Poisson-process distribution. Dashed lines represent the standard error of the regression. (e) The minimum distance to nearest neighbor (rcrit) required for aScaf-pScaf assembly predicted by the random distribution. Experimental data are represented as the mean of two independent experiments (n = 2) and error bars signify standard deviation unless otherwise noted. Statistical significance was evaluated from paired regression z-scores where ns (i.e. not significant) signifies p-value > 0.05, * signifies that p-value < 0.05, ** signifies p-value < 0.01, and *** signifies p-value < 0.001.

