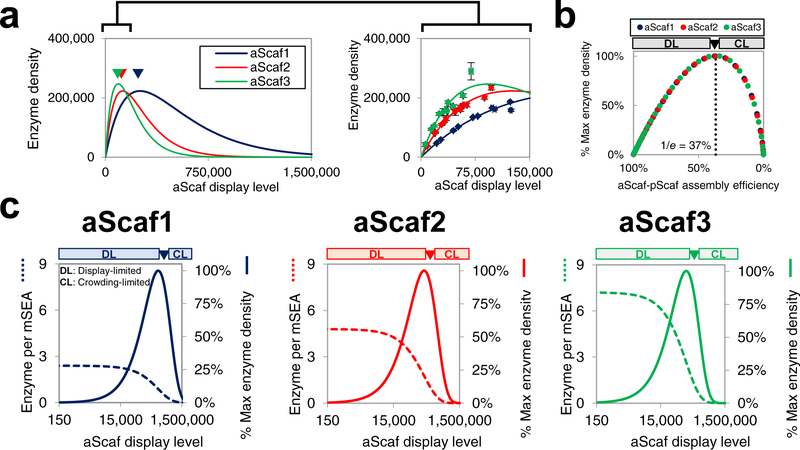
Figure 5:
Modeling theoretical mSEA assembly (a) The theoretical enzyme density plotted as a function of aScaf display level. Data shown on right is a zoomed-in view across a physiologically relevant range of aScaf display levels and with experimental data overlaid. Experimental data are represented as the mean of two independent experiments (n = 2) and error bars signify standard deviation (b) Predicted enzyme density as a percent of the theoretical maximum plotted with respect to aScaf-pScaf assembly efficiency. (c) Tradeoff between the theoretical number of enzymes per mSEA (dashed lines) and the percent of theoretical maximum enzyme density (solid lines) plotted as a function of aScaf display level for aScaf1, aScaf2, and aScaf3. Theoretical mSEA assembly was determined assuming 60% pScaf-enzyme assembly efficiency and rcrit values found using the Poisson-process distribution. DL represents the aScaf display-limited regime and CL represents the aScaf crowding-limited regime.

