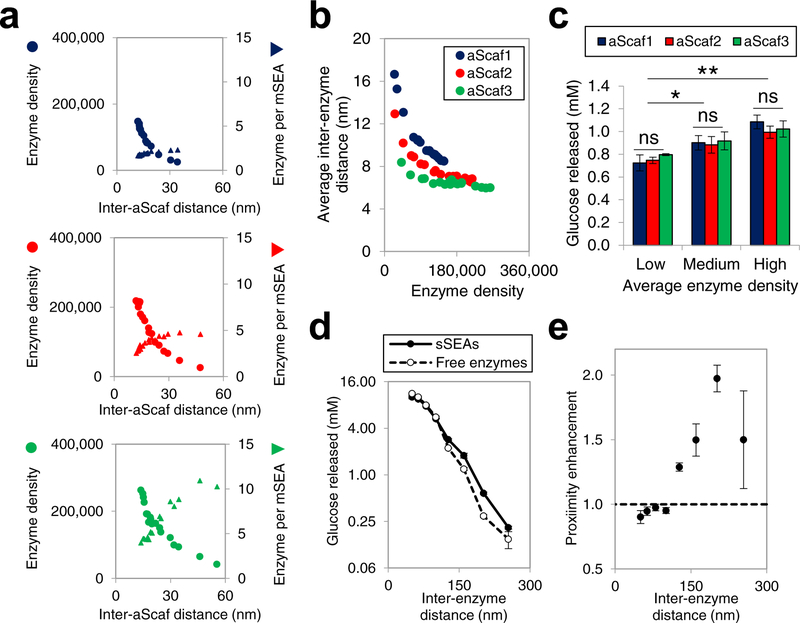
Figure 6:
Structure-performance relationship of multi-enzyme assemblies (a) Enzyme density (circle) and the number of enzyme per mSEA (triangle) plotted as a function of inter-aScaf distance for aScaf1, aScaf2, and aScaf3. (b) Average inter-enzyme distance plotted as a function of enzyme density for aScaf1 (blue), aScaf2 (red), and aScaf3 (green). Average inter-enzyme distance was calculated using parameters determined in (a). (c) Glucose released from 0.3% phosphoric acid swollen cellulose (PASC) by yeast whole-cell biocatalysts displaying mSEAs on aScaf1, aScaf2, and aScaf3. Low, medium, and high corresponds to enzyme density of ~50,000 per cell, ~100,000 per cell, and ~150,000 per cell, respectively. (d) Glucose released from 0.3% PASC by an equimolar mixture of free enzymes (open circles) or an equivalent amount of enzyme assembled on soluble pScaf proteins (sSEAs, filled circles), plotted as a function of inter-enzyme distance. (e) Proximity enhancement of sSEAs over soluble enzymes on PASC hydrolysis plotted as a function of inter-enzyme distance. Error bars on data represent standard deviation from the mean of two independent experiments (n = 2) Statistical significance was evaluated using unpaired student t tests where ns (i.e. not significant) signifies p-value > 0.05, * signifies that p-value < 0.05, ** signifies p-value < 0.01, and *** signifies p-value < 0.001.

