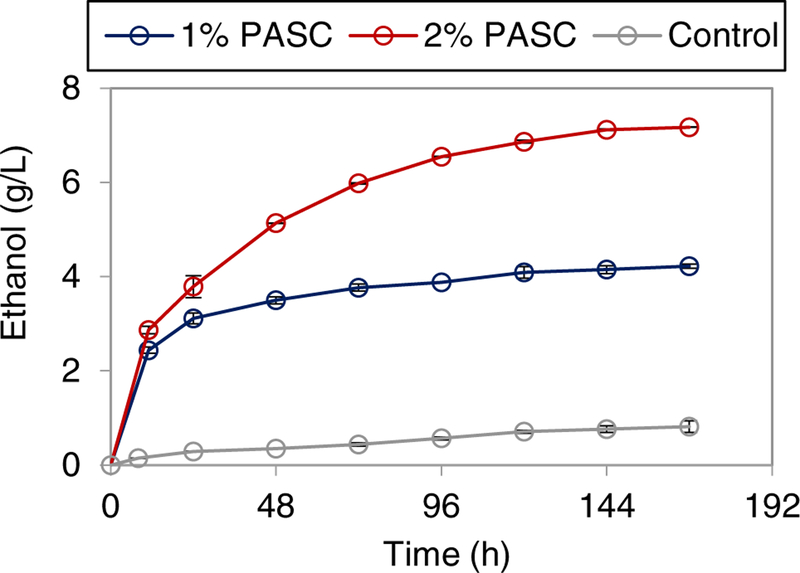
Figure 7:
Time course of ethanol production from PASC by aScaf3-mSEA. Ethanol production from 1% PASC (blue) and 2% PASC (red), were recorded over 168 hours. Yeast displaying cells without enzyme loaded were used as a control. Data are represented as the mean of two independent experiments (n = 2) and error bars signify standard deviation.

