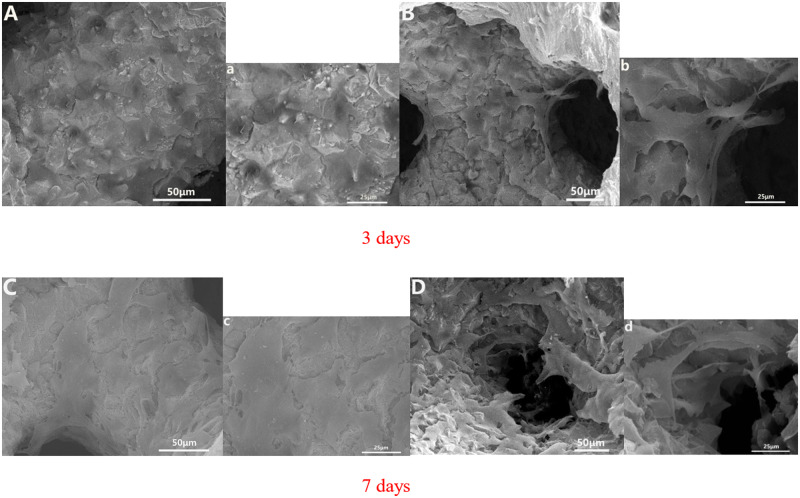
Figure 5.
SEM morphology of MG-63 human osteoblast cells on pTa that were co-cultured for 3 and 7 days in vitro: (A, C) the pTa surface cell growth images and (B, D) cell growth images in pTa pores. The large image was magnified ×500 with a scale bar = 50μm; the small image was magnified ×1000 with a scale bar = 25 μm.

