Figure 3.
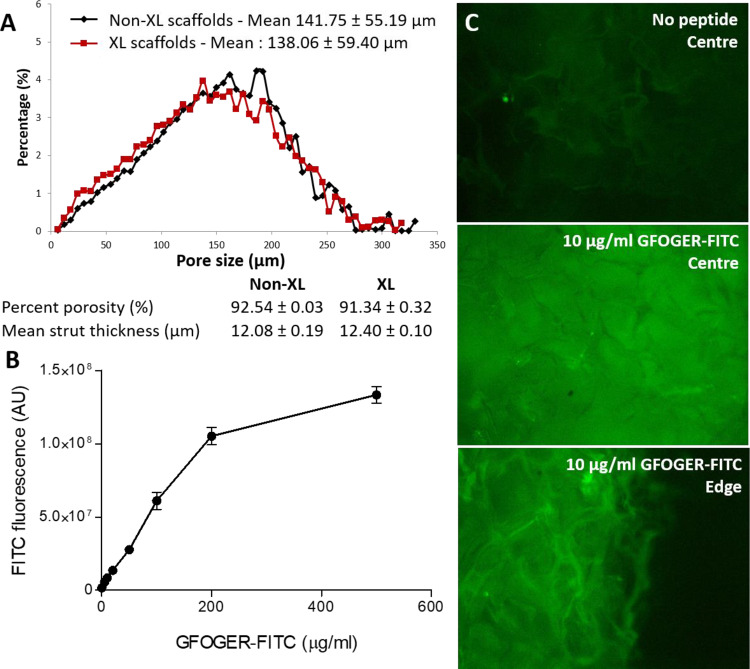
Scaffold characterization (A) Non-cross-linked (Non-XL) and EDC/NHS cross-linked (XL) collagen scaffold inner structure was analysed by X-ray microtomography. Pore sizes ranged from 0 to 280 µm and assumed a Gaussian distribution with an average size of 138–142 µm. Pore size and distribution were identical before and after EDC/NHS cross-linking. Non-cross-linked and cross-linked scaffolds had consistently high porosity of over 90% and mean strut thickness around 12 µm. (B) FITC fluorescence intensity in EDC/NHS cross-linked scaffolds incubated with GFOGER–FITC at concentrations ranging from 0 to 500 µg/ml. FITC fluorescence intensity linearly increased with GFOGER–FITC concentration up to 200 µg/ml before reaching saturation. (C) Representative fields of view of the FITC–GFOGER distribution in scaffolds loaded at 10 µg/ml. GFOGER–FITC was grafted homogeneously throughout scaffolds with no evident difference in fluorescence intensity between the edges and the centre.

