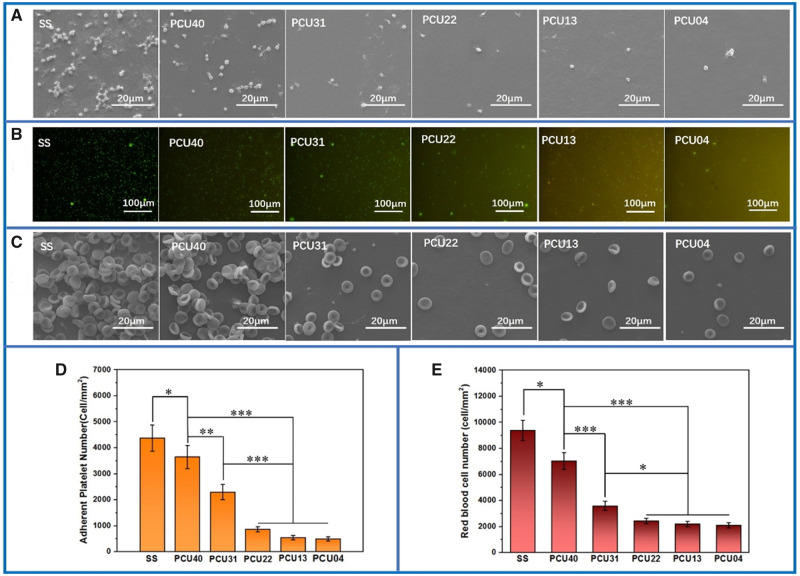
Figure 6.
(A) SEM results and (B) rhodamine staining of platelets adhered on different samples surface. (C) SEM results of whole-blood adhered on different samples surface. (D) Quantitative analysis of platelets and (E) red blood cells adhered on different samples surface (*P < 0.05, **P < 0.01 ***P < 0.001, mean ± SD, N = 5)

