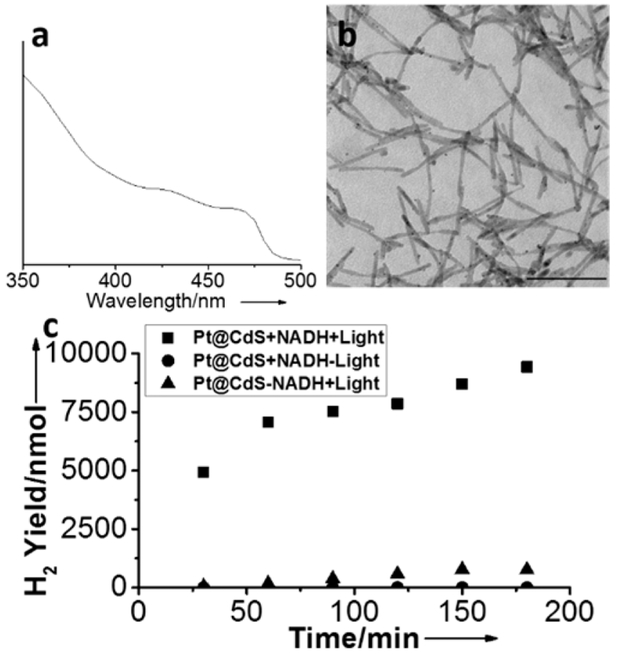
Figure 1.
(a) Ultraviolet–visible light (UV-vis) spectrum of Pt-decorated CdS nanorods. (b) Transmission electron microscopy (TEM) image of Pt-decorated CdS nanorods. Scale bar = 100 nm. (c) Production of H2 over a reaction time of 3 h from 25 nM Pt@CdS (■) in the presence and (▲) in the absence of 3 mM NADH, as well as (●) in the absence of irradiation.

