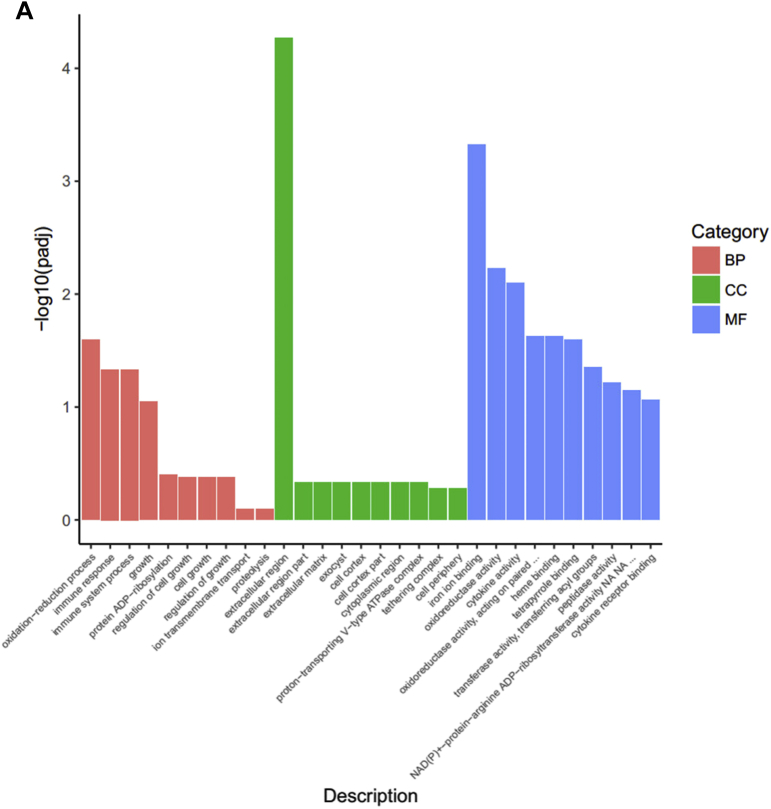
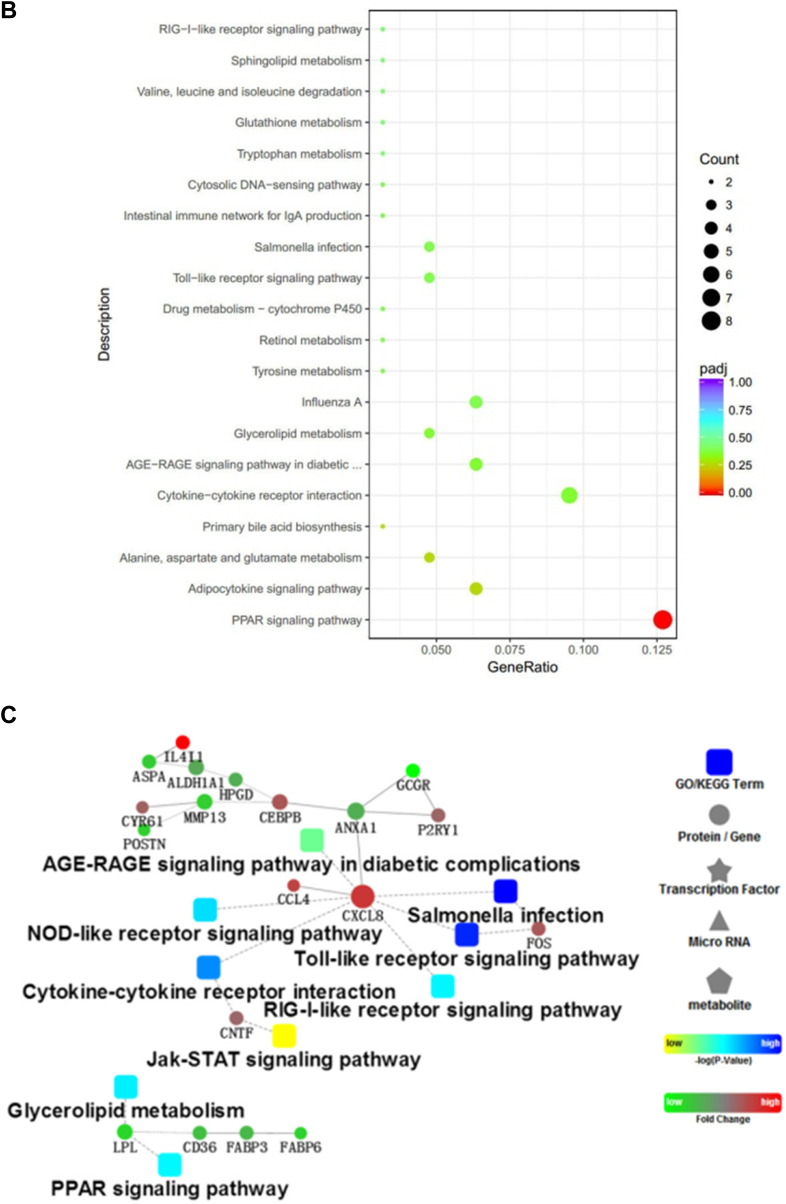
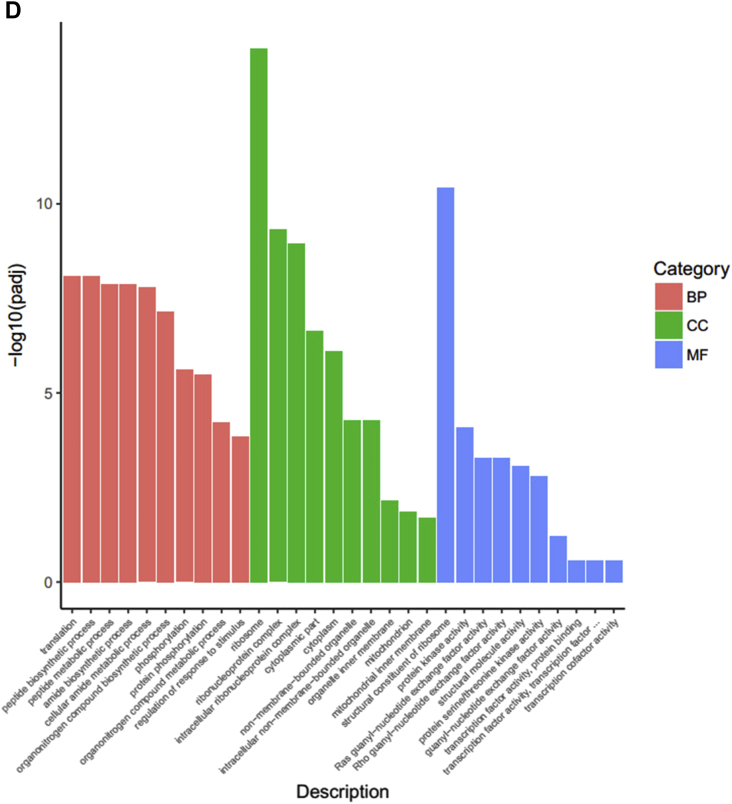
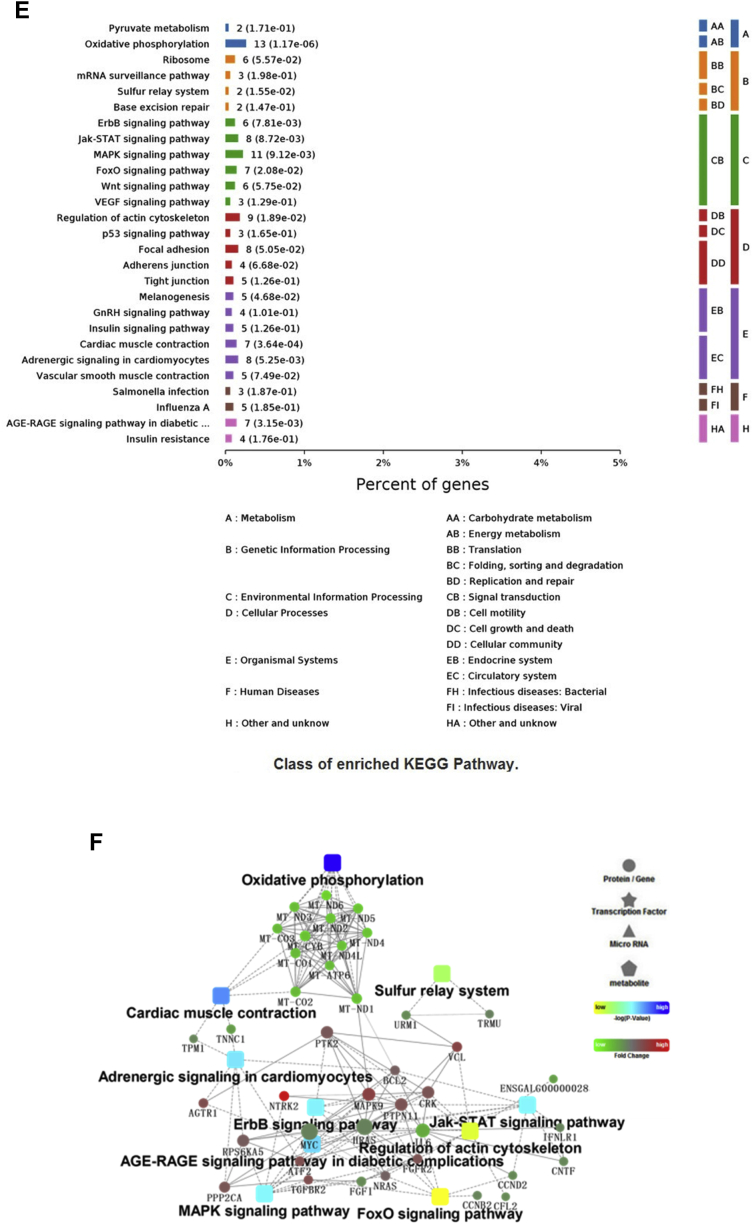
Figure 5.
(A, D) The top 10 enriched items in each main category (biologic process, cell component, and molecular function) of the GO database at all levels using DEGs of the LPS vs. CON groups and the GEN vs. LPS groups, respectively. (B, E) The top enriched KEGG items using DEGs of the LPS vs. CON groups and the GEN vs. LPS groups, respectively. (C, F) Protein-protein interaction analysis using DEGs of the LPS vs.CON groups and the GEN vs. LPS groups, respectively. Circular nodes represent genes/proteins; rectangles represent KEGG pathways or GO Biologic Process terms. The pathways are colored with a gradient from yellow to blue, in which yellow indicates a smaller P value, and blue indicates a larger P value. GO biologic processes are colored red. In the fold-change analysis, genes/proteins are colored red for upregulation or green for downregulation. Abbreviations: CON, nonchallenge control; DEG, differently expressed gene; GEN, lipopolysaccharide-challenged group fed diet supplemented with 40 mg/kg genistein; LPS, lipopolysaccharide-challenged group; GO, gene ontology; KEGG, Kyoto Encyclopedia of Genes and Genomes.


