
Fig. 14.
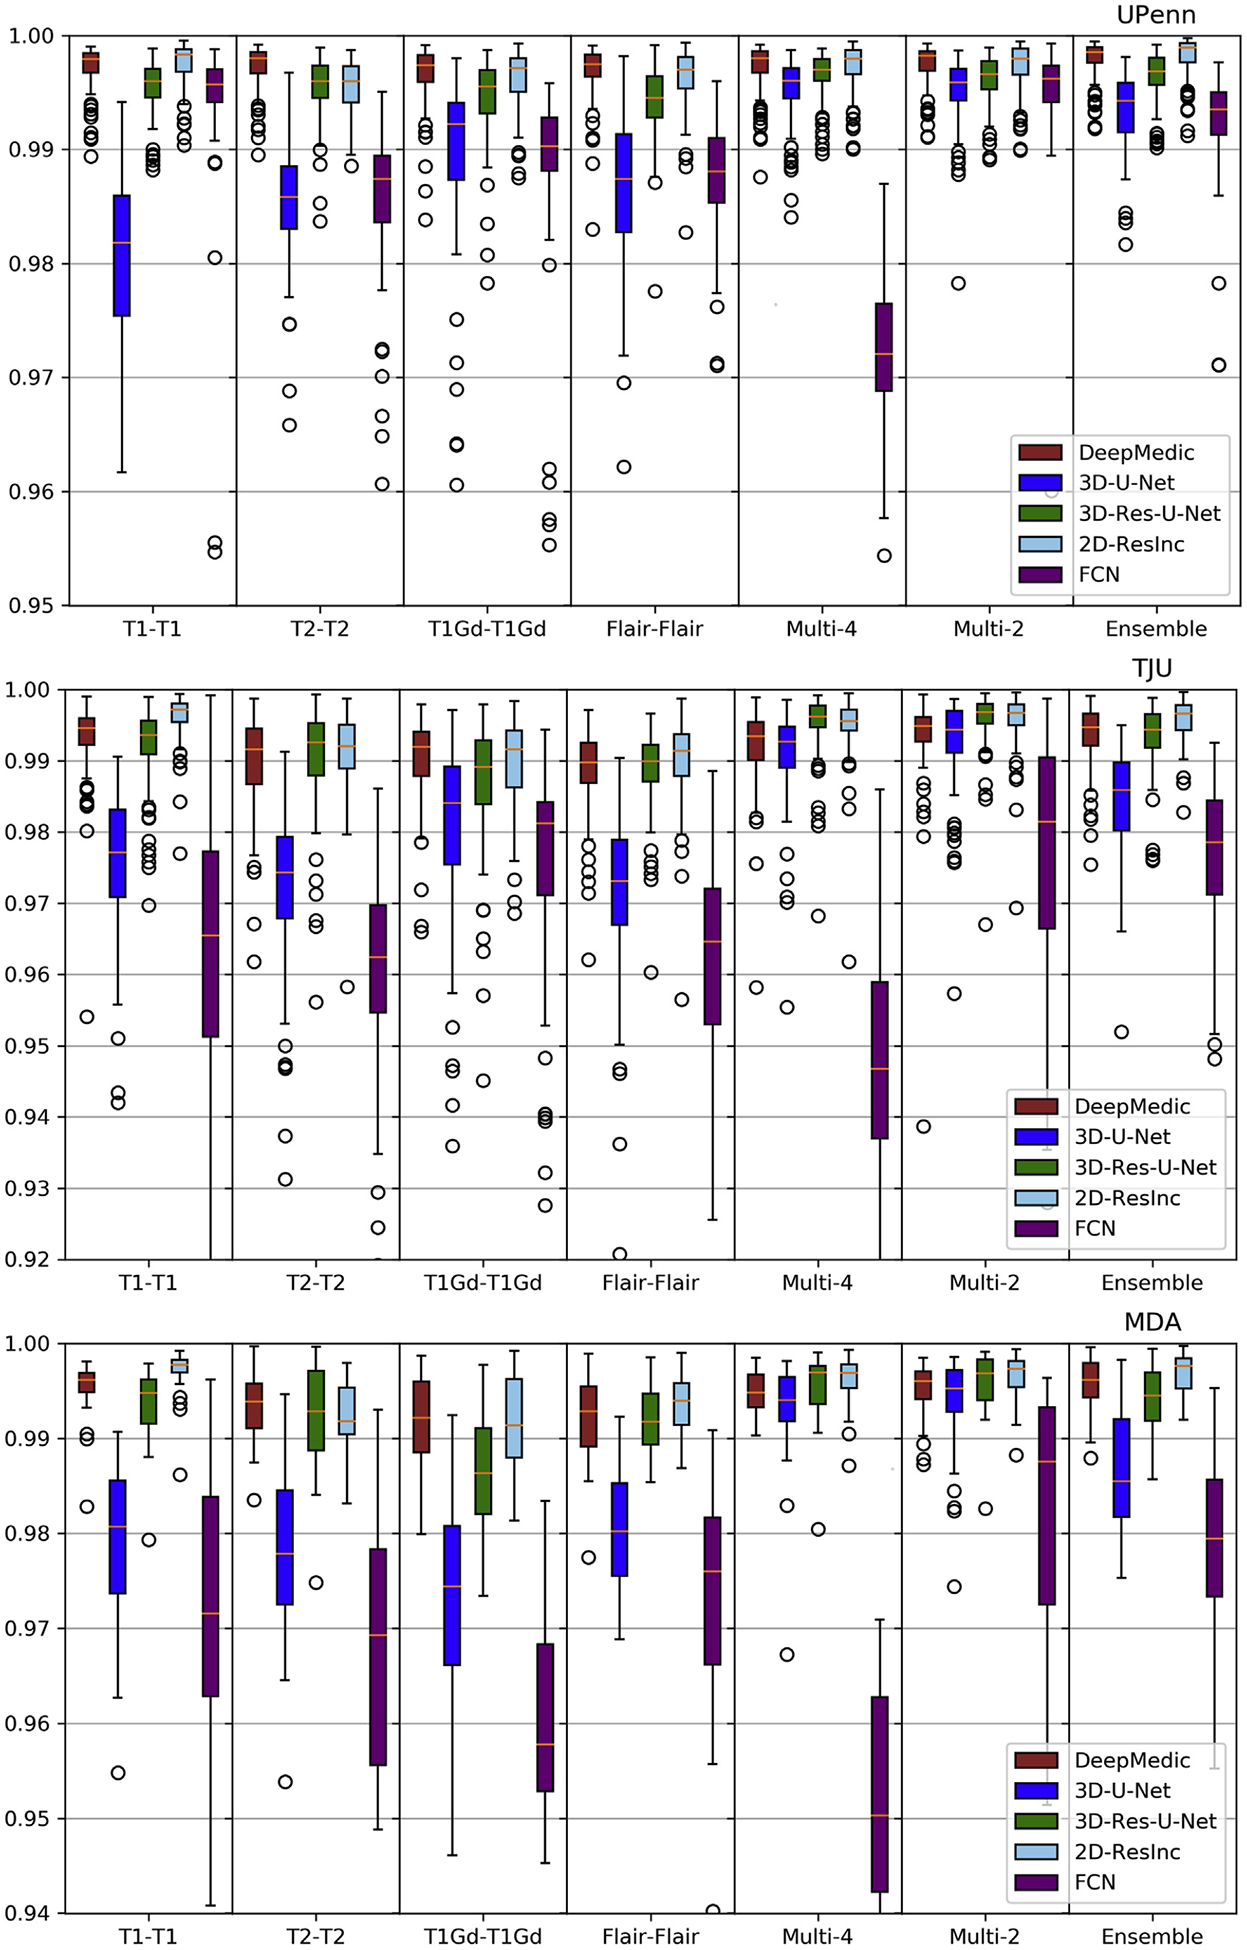
Quantitative (average Specificity) evaluation of various DL network architectures. From top to bottom rows we see results on the data from (a) UPenn, (b) TJU, and (c) MDA. The evaluated models in this figure include training on individual modalities and their ensemble using majority voting, as well as multi-modality training.