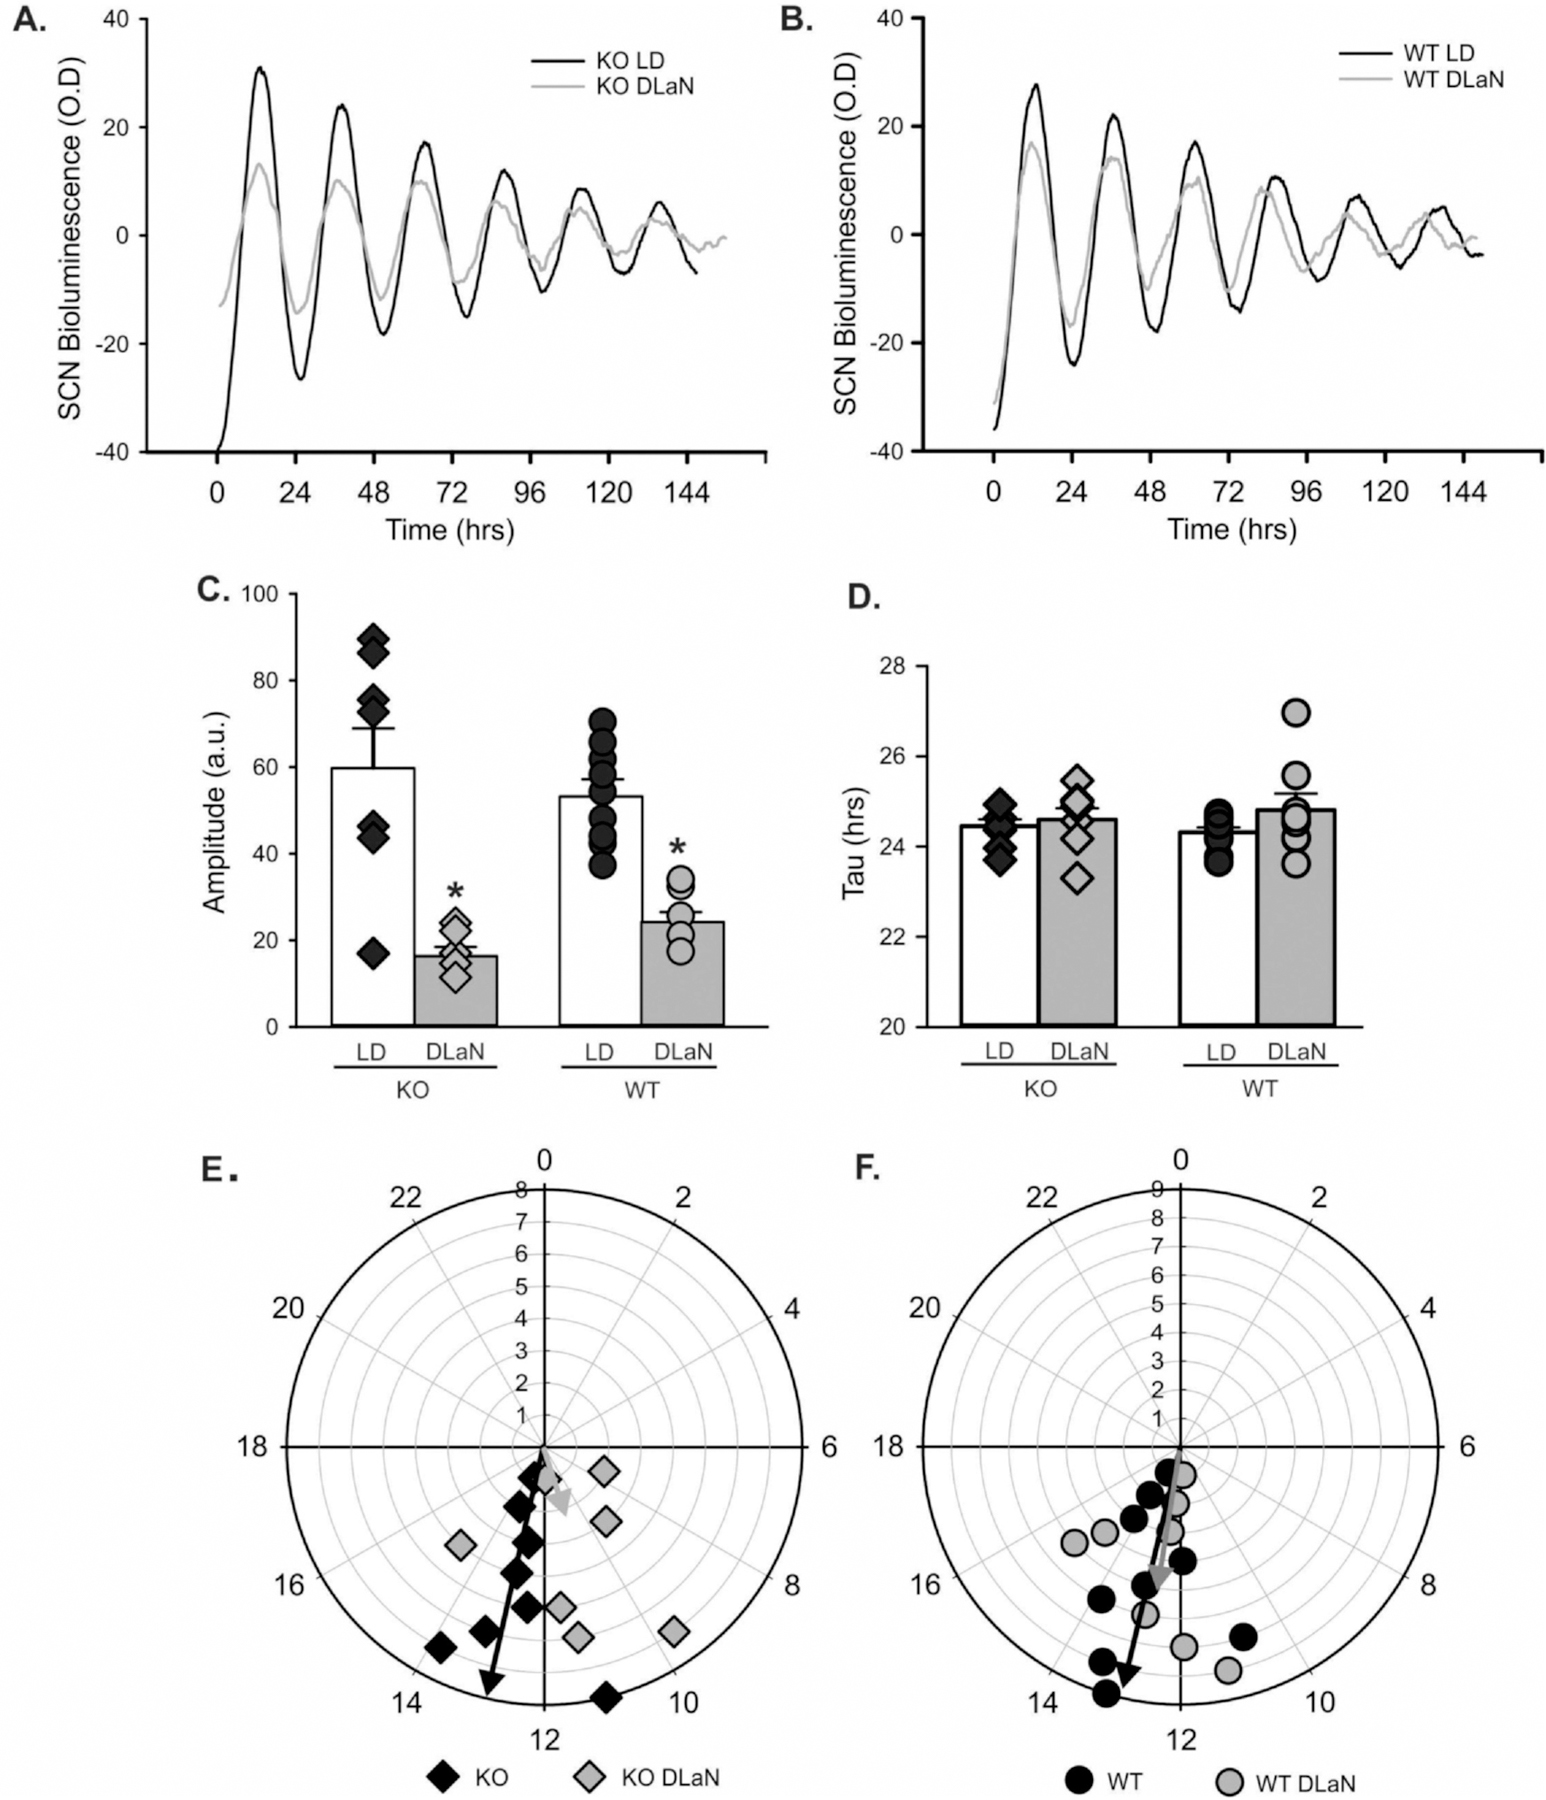
Fig. 4.

DLaN alters the PER2:LUC bioluminescence rhythms measured in the SCN. Representative examples of bioluminescence rhythms measured from the Cntnap2 KO (A) and WT (B) SCN under LD and DLaN conditions. Several parameters were measured from the bioluminescence rhythms and analyzed with 2-way ANOVA. Histograms show means ± SEM with the values from individual animals overlaid. Significant (P < 0.05) differences because of treatment are indicated with an asterisk (*) over the treated values while the number sign (#) indicates a genotypic difference. (C) The amplitude was reduced by treatment (F(1,31) = 47.458, P < 0.001) but there was no differences between the genotypes (F(1,31) = 0.014, P = 0.907). (D) There was no difference in the tau (free-running period) measured by treatment (F(1,31) = 1.838, P = 0.186) or genotype (F(1,31) = 0.024, P = 0.879). (E, F) Polar plots show the peak phase of the rhythms measured under each condition. The numbers show the phases (ZT) with ZT 0 showing the time of light-onset. The peak phase varied with both treatment (F(1,31) = 4.726, P = 0.038) and genotype (F(1,31) = 4.424, P = 0.045). The vector indicates the peak phase and the amplitude relative to WT controls. Overall, DLaN decreased the amplitude of rhythms in both genotypes and caused a phase advance in the mutants only.
