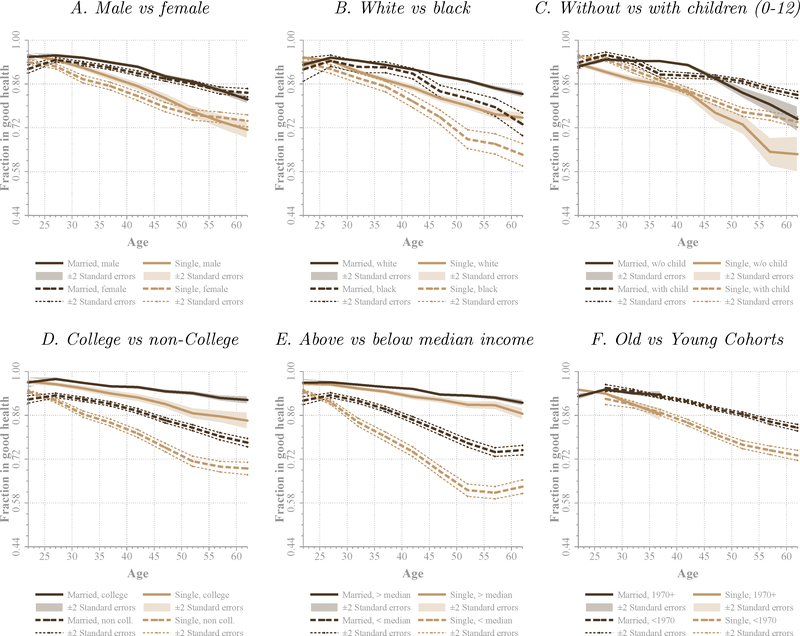
Figure B1. Health and Marital Status, Different Socioeconomic Groups (MEPS).
Note: This figure reproduces the results in Figure 2 using the MEPS sample. Plotted lines represent the weighted fraction of married and unmarried individuals that report being healthy. Fractions are reported, as indicated, for male and female, white and black, without and with children aged 0–12 living in the household, college graduates and non-college, above and below median income, and born after and before 1970. The horizontal axis indicates age, which is grouped in five-year categories (20–24 through 60–64). Confidence bands of ± two standard errors are computed using sample stratification design.

