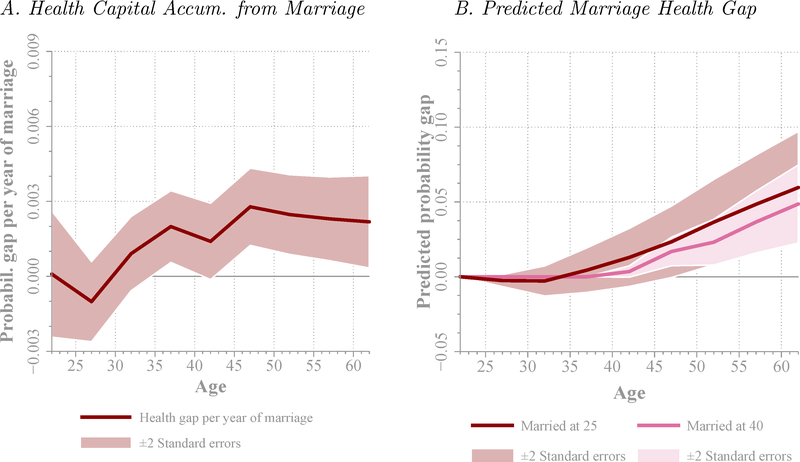
Figure 13. Health Accumulation Through Marriage.
Note: The left figure shows fixed-effect estimates of the health capital accumulated from marriage from a modified version of equation (1) in which the married dummy m is replaced by the number of years an individual have been married (zero if never married). Estimates are done with the PSID. The right figure plots the predicted marriage health gap for individuals married at age 25 and at age 40. Control variables include female, black, and college dummies, income, dummies for 0–3, 4–12, and 13–18 year-old children at home, and year of birth dummies; regressions also estimate the health curve for singles. The horizontal axis indicates age. In estimation, five-year age bins (20–24 through 60–64) are considered and the center point of the bin is graphed. Dotted lines are ± two standard errors confidence bands around point estimates, clustered at the household level.

