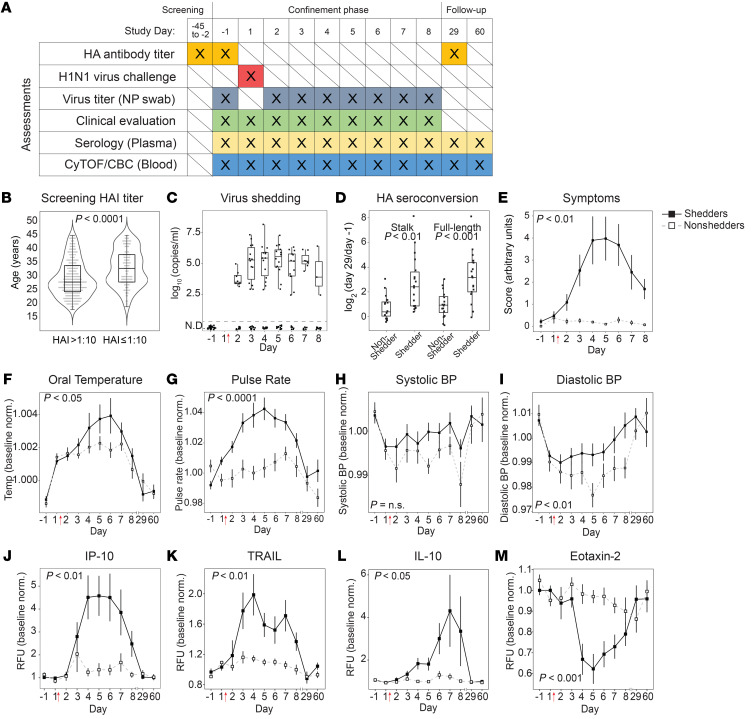
Figure 1. Influenza challenge model in human volunteers.
(A) Schedule of assessments performed throughout the screening, confinement, and follow-up phases of the study. Study days –1 and 1 are consecutive calendar days. Intranasal virus inoculation was performed on study day 1 immediately after blood draw. NP, nasopharyngeal. (B) Of the screened population (n = 437), the distributions of ages for those with HAI titers >1:10 (eligible for inclusion) and with HAI titers ≤1:10 (ineligible). (C) Viral titers as measured by qRT-PCR in nasopharyngeal swabs (n = 19 virus shedders). Viral titers were below the limit of detection for all participants on study day –1, and for 16 individuals throughout the study (nonshedders). (D) Stalk-specific and full-length-HA antibody seroconversion measured by ELISA. Values shown are day 29 relative to day –1. (E) Mean daily symptom score as determined by participant-reported symptom scorecard. (F–I) Baseline-normalized values for maximum daily oral temperature (F), mean pulse rate (G), systolic blood pressure (H), and diastolic blood pressure (I). Vital signs were measured up to 4 times daily. (J–M) Baseline-normalized plasma cytokine and chemokine levels, in relative fluorescence units (RFU), measured by Luminex assay for IP-10 (J), TRAIL (K), IL-10 (L), and eotaxin-2 (M). In E–M, data for virus shedders are indicated with filled squares and solid lines; data for nonshedders are indicated with open squares and dashed lines (mean ± SEM). In F–M, values plotted are normalized to baseline (average of day –1, 1). (C–M) n = 35 volunteers. Welch’s t test (B and D); Bonferroni’s adjusted P value of the time-shedding interaction term (E–M). Red arrows indicate the time point of virus inoculation throughout all figures.

