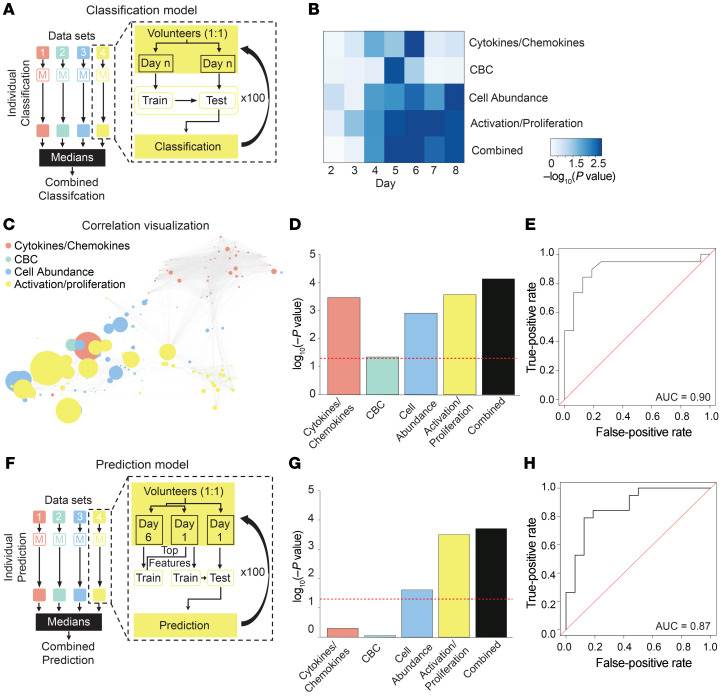
Figure 9. Machine learning–based classification and prediction of H1N1 virus shedding status.
(A) Schematic of models used to classify virus shedding after challenge. Four models were generated from 4 data sets: cytokines/chemokines; CBC; cell abundance; and cell activation and proliferation (Supplemental Table 8). For each data set, the model was iteratively trained and tested on 50% held-out data 100 times. The performance for each individual model was the median value from 100 iterations. For the stacked model, individual models were combined. (B) Heatmap of P values for classification of virus shedding status on days 2–8. (C) Correlation network displays the relationship between features used in the combined model. Node sizes are proportional to the univariate correlation between a given feature and virus shedding. (D) The P values for each model on the day with the best overall classification power (day 6). (E) Receiver operating characteristic (ROC) curve evaluating the performance of the combined classification model on day 6. (F) Schematic of model used to predict virus shedding before challenge. The 4 data sets from A were used to generate a predictive model that was trained and tested iteratively on 50% held-out data 100 times. In contrast to A, only the top features associated with classification of virus shedding on day 6 from each data set were used to train models on day 1 data. Models were subsequently evaluated on the excluded day 1 test set. The performance for each individual model was the median value from 100 iterations. For the final model, individual models were combined. (G) The P values for each model on day 1. (H) ROC curve evaluating the performance of the combined predictive model on data collected on day 1. Wilcoxon’s signed-rank test (A–H). n = 35 volunteers.

