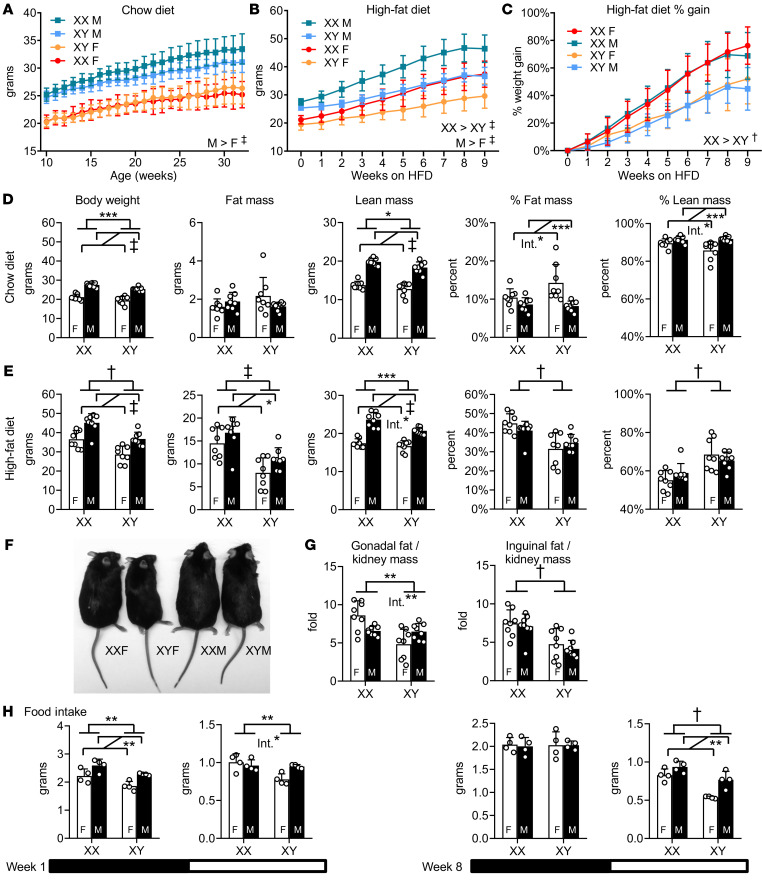
Figure 1. XX mice gain more weight than XY mice on a high-fat diet.
(A) Body weight curves of gonadally intact FCG mice fed a chow diet. XX and XY refer to chromosome type; F, female gonads (ovaries); M, male gonads (testes). n = 11 XX female; n = 11 XX male; n = 12 XY female; n = 16 XY male. (B) Body weight and (C) percentage weight gained in FCG mice over 10 weeks on high-fat diet, starting at 14 weeks of age. n = 8 mice per genotype (B–G). (D) Body weight, fat mass, lean mass, percentage of fat mass, and percentage of lean mass on chow and (E) after 10 weeks of high-fat feeding. (F) Representative mice after 10 weeks of high-fat diet (individuals with median body weight shown for each genotype). (G) Gonadal and inguinal fat pad mass normalized to kidney mass. (H) Food intake measured at 1 week (left) and at 8 weeks (right) of high-fat diet feeding during the dark (black horizontal bar) and light (white horizontal bar) periods of the circadian cycle (note different y axis scales). n = 4 mice per genotype. Data are represented as mean ± SD. Data in A–C were analyzed by repeated measures 3-way ANOVA (factors of gonadal sex, sex chromosomes, and age). Data in D–H were analyzed by 2-way ANOVA. Statistically significant differences for sex chromosome complement and for gonadal sex are denoted by brackets. Int., significant interactions of sex chromosome complement and gonadal sex. *P < 0.05; **P < 0.01; ***P < 0.001; †P < 0.0001; ‡P < 0.00001. HFD, high-fat diet.

