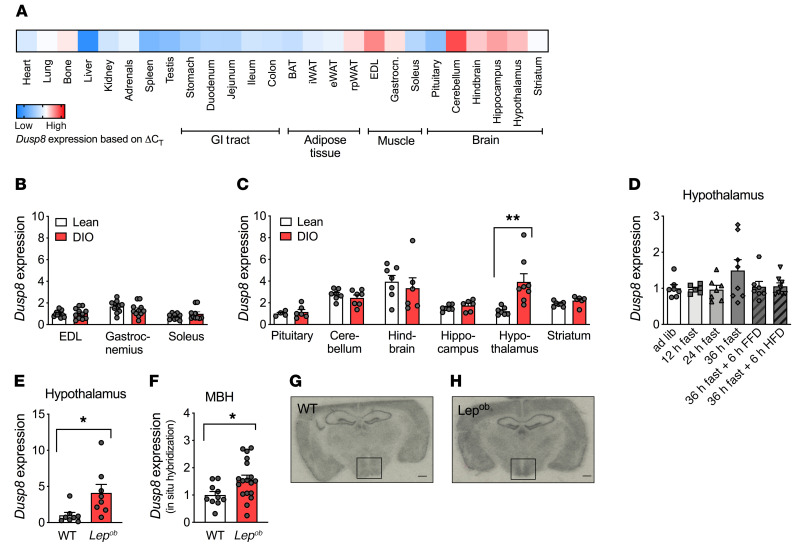
Figure 1. Hypothalamic Dusp8 expression is regulated by body adiposity.
(A) Tissue-specific expression levels of Dusp8 were assessed in lean C567BL/6J male mice (n = 3) and are presented as ΔCT values with low Dusp8 expression in blue and high Dusp8 expression in red. Regulation of Dusp8 expression by adiposity was analyzed in lean vs. diet-induced obese (DIO) male mice for (B) skeletal muscle (extensor digitorum longus, EDL [n = 12 WT, n = 11 KO], gastrocnemius [n = 11 WT, n = 12 KO], soleus [n = 10 WT, n = 12 KO]) and (C) microdissected brain regions (pituitary [n = 4 WT, n = 6 KO], cerebellum [n = 6 WT, n = 6 KO], hindbrain [n = 6 WT, n = 5 KO], hippocampus [n = 5 WT, n = 6 KO], hypothalamus [n = 6 WT, n = 6 KO], and striatum [n = 6 WT, n = 5 KO]) and is shown as ΔCT values. iWAT, inguinal white adipose tissue; eWAT, epididymal white adipose tissue; rpWAT, retroperitoneal white adipose tissue. (D) Hypothalamic Dusp8 mRNA expression in C57BL/6J mice that were subjected to 12 (n = 6), 24 (n = 7), or 36 (n = 8) hours of fasting as well as refeeding for 6 hours with fat-free (FFD, n = 7) or high-fat (HFD, n = 8) diet compared with ad libitum–fed control (n = 7). (E) Hypothalamic Dusp8 mRNA levels in male Lepob vs. WT mice (n = 8). (F) Densitometric analysis of Dusp8 mRNA by in situ hybridization localized Dusp8 expression to the MBH of male (G) WT (n = 10) and (H) Lepob mice (n = 18) mice; representative pictures are shown. Data are shown as heatmap (A) or as scatter dot plots with means ± SEM (B–F). Scale bars: 500 μm. *P < 0.05; **P < 0.01 by Student’s t test (B, C, E, and F) or 1-way ANOVA (D).

