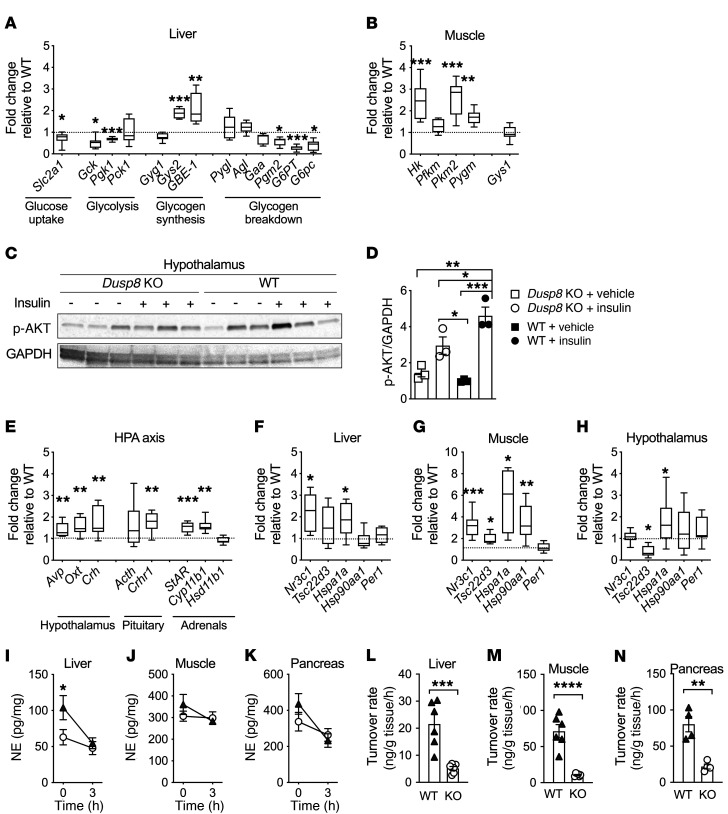
Figure 3. Elevated glucocorticoid action and impaired hypothalamic insulin sensitivity and sympathetic responsiveness in HFD-fed Dusp8-KO males.
(A) Gene transcripts of hepatic enzymes involved in glucose metabolism (n = 7 WT, n = 8 Dusp8-KO) and (B) glucoregulatory enzymes in skeletal muscle (n = 8 WT, n = 8 Dusp8-KO) in 17-week HFD–fed, male Dusp8-KO mice relative to WT controls. (C) Representative Western blot and (D) densitometric analysis of phosphorylated Akt relative to GAPDH in hypothalami of HFD-fed (17 weeks) Dusp8-KO and WT males that were acutely injected with 3 IU insulin/kg BW or saline as control and sacrificed 8 minutes later (n = 3). (E) Gene transcripts related to HPA axis regulation measured in the hypothalamus (n = 8 WT, n = 8 Dusp8-KO) and pituitary (n = 8 WT, n = 8 Dusp8-KO) as well as enzymes involved in steroid synthesis measured in the adrenals (n = 8 WT, n = 7 Dusp8-KO) of 17-week HFD–fed mice. Tissue-specific glucocorticoid action in (F) liver, (G) muscle, and (H) hypothalamus (n = 8 WT, n = 8 Dusp8-KO) analyzed by qPCR. (I–K) Norepinephrine (NE) tissue content before and 3 hours after α-MPT injection and (L–N) NE turnover rates in the liver, soleus, and pancreas of male Dusp8-WT and -KO mice exposed to HFD for 16 weeks (n = 6 for liver and soleus, n = 4 for pancreas). Data are shown as box-and-whisker-plots (A, B, and E–H), as scatter dot plots (D and L–N), or as means ± SEM (I–K). *P < 0.05; **P < 0.01; ***P < 0.001; ****P < 0.0001 by Student’s t test (A, B, E–H, and L–N), 1-way ANOVA (D), or 2-way ANOVA (I–K).

