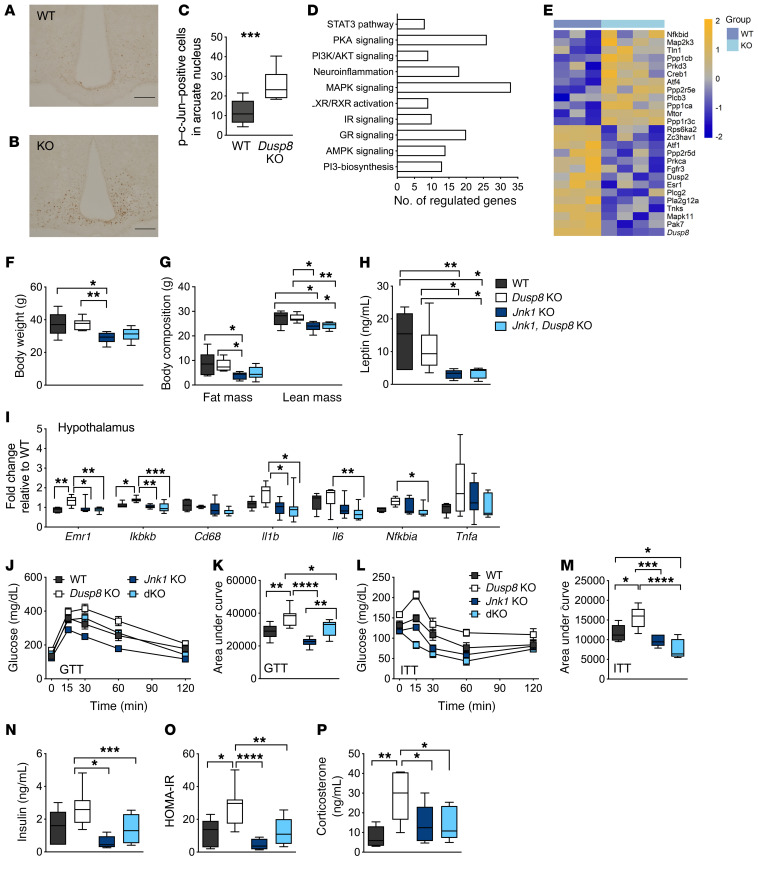
Figure 6. Glucose intolerance in HFD-fed male Dusp8-KO mice is mediated by Jnk.
Representative immunohistochemical detection of c-Jun phosphorylation in hypothalamic slices of male (A) WT (n = 14) and (B) Dusp8-KO (n = 9) littermates after 18 weeks of HFD feeding and (C) counting of positively stained nuclei. (D) Pathway enrichment and (E) heatmap for MAPK signaling genes including Dusp8 from microarray analyses of laser-capture-microdissected ARC of HFD-fed Dusp8-KO (n = 4) and WT (n = 3) mice. Relative gene expression values are shown across samples (z scales to mean expression per row). (F) Body weight and (G) body composition, (H) plasma leptin levels, and (I) markers of hypothalamic inflammation of male Dusp8-KO (n = 7), Jnk1-Dusp8–dKO (n = 9), and Jnk1-KO (n = 8) mice relative to WT controls (n = 6) were measured after 18 weeks of HFD exposure. (J–M) Glucose tolerance (GTT) and insulin tolerance tests (ITT) were carried out after 16 weeks or 17 weeks of HFD exposure, respectively (n = 6 WT, n = 7 Dusp8-KO, n = 8 Jnk1-KO, n = 9 dKO). (N) Plasma insulin levels were measured in WT (n = 6), Dusp8-KO (n = 7), Jnk1-Dusp8–dKO (n = 9), and Jnk1-KO mice (n = 8) after 18 weeks of HFD exposure to calculate the HOMA-IR (O). (P) Plasma corticosterone levels were measured in WT (n = 6), Dusp8-KO (n = 7), Jnk1-Dusp8–dKO (n = 9), and Jnk1-KO mice (n = 7) after 18 weeks of HFD. Data are shown as box-and-whisker plots (C, F–I, K, and M–P) or as means ± SEM (J and L). Scale bars: 200 μm. *P < 0.05; **P < 0.01; ***P < 0.001; ****P < 0.0001 by Student’s t test (C), 1-way ANOVA (F–I, K, and M–P), or 2-way ANOVA (J and L).

