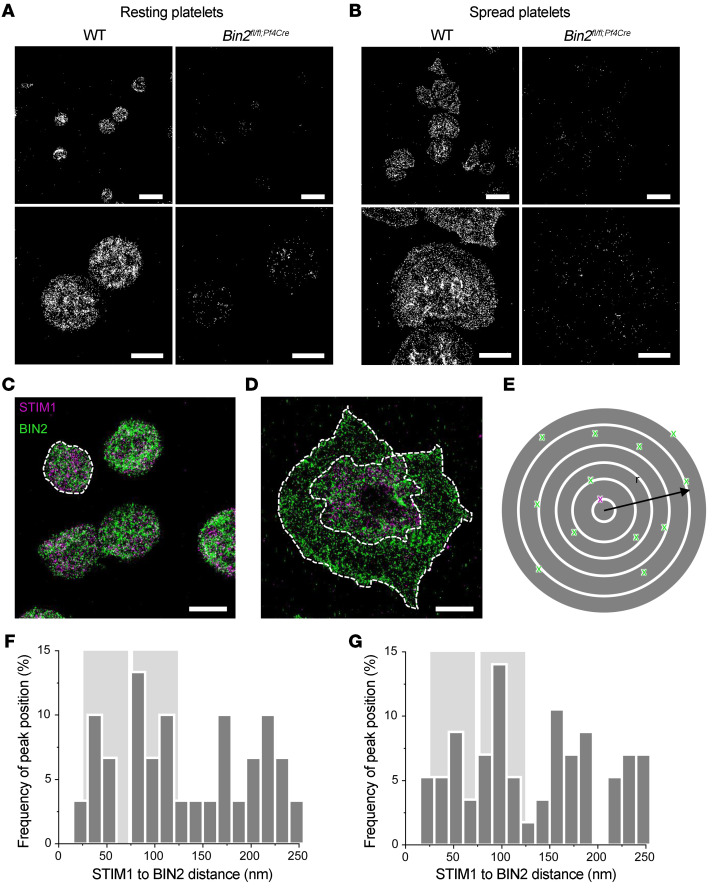
Figure 4. BIN2 STIM1 colocalization in human platelets.
dSTORM images of (A) resting mouse platelets on glycine or (B) thrombin-activated WT and Bin2fl/fl,Pf4Cre mouse platelets on fibrinogen, stained for BIN2. Scale bars 5 μm (upper panel) and 2 μm (lower panel). Dual-color dSTORM allows resolution of the distribution of STIM1 (magenta) and BIN2 (green) in (C) resting and (D) activated human platelets; dashed white lines indicate areas of neighbor density analysis (E) between STIM1 (magenta) and BIN2 (green), with discrete ring areas in which the BIN2 density was determined (dark gray). In activated spread platelets, only localizations in the inner region where the organelles and intercellular membrane compartments accumulate were considered for STIM1. Colocalization hotspots of STIM1 and BIN2 are identified by analyzing the BIN2 density at increasing radial distances to STIM1: Histograms of the distance-dependent BIN2 density peak maxima found for (F) resting (n = 6, Supplemental Figure 7A) and (G) activated human platelets (n = 14, Supplemental Figure 7B). The distinct STIM1 to BIN2 distance regions with increased accumulation of colocalization hotspots are highlighted in light gray. Scale bars (C and D): 2 μm.

