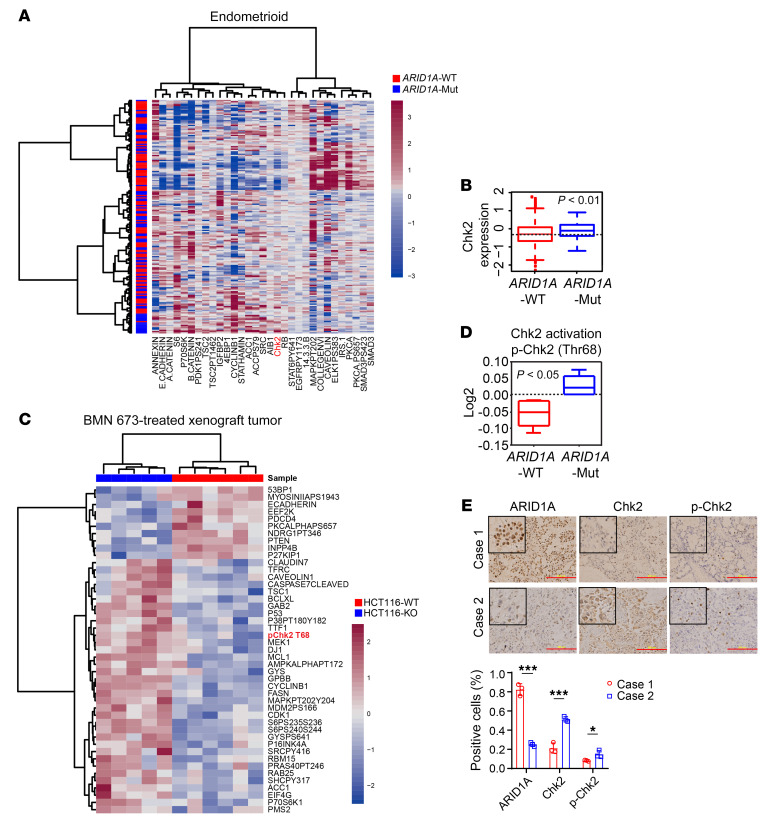
Figure 1. Chk2 signaling is enhanced in tumors with mutant ARID1A or low expression of ARID1A.
(A) Heatmap representing expression profiles of the 31 proteins most differentially expressed between ARID1A-WT and ARID1A-mutant (ARID1A-Mut) endometrioid carcinomas from patients. P < 0.05 (n = 187). (B) Chk2 protein levels in ARID1A-WT and ARID1A-Mut endometrioid carcinomas from patients. P < 0.01 (n = 187). (C) Heatmap representing RPPA expression profiles of the 45 proteins most differentially expressed between HCT116-WT (n = 6) and HCT116–ARID1A-KO (HCT116-KO) (n = 5) xenograft tumors treated with PARP inhibitor BMN 673. P < 0.05. (D) p-Chk2 (Thr68) protein levels in HCT116-WT (n = 6) and HC116–ARID1A-Mut (n = 5) xenograft tumors treated with BMN 673. P < 0.05. (E) Top, representative images of IHC staining of ARID1A, Chk2, and p-Chk2 in ovarian clear cell carcinoma patient specimens (n = 8). Scale bar: 200 μm. Bottom, quantitative results represent the mean ± SD. *P < 0.05; ***P < 0.001. Two-tailed unpaired Student’s t test (A–E).

