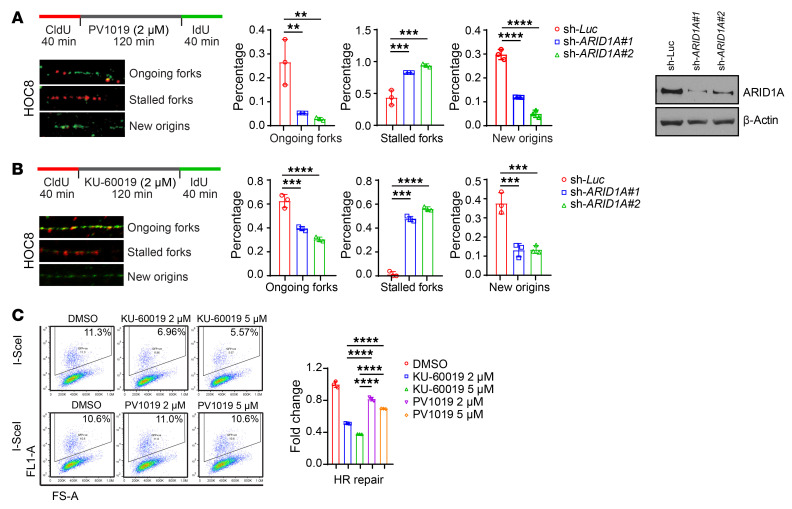
Figure 4. Inhibition of the ATM/Chk2 axis selectively enhances replication stress in ARID1A-deficient cancer cells.
(A and B) Left, representative images of DNA fiber assay in control (sh-Luc) and ARID1A-depleted (sh-ARID1A#1 and #2) HOC8 cells treated with PV1019 (A) and KU-60019 (B) at indicated concentrations. Middle, quantitative results represent the mean ± SD from 3 independent experiments. **P < 0.01; ***P < 0.001; ****P < 0.0001 by 1-way ANOVA with Dunnett’s multiple comparisons test. Right, Western blots indicate effective ARID1A knockdown. (C) Analysis of homologous recombination (HR) efficiency with the DR-green fluorescent protein (GFP) assay. Left, representative flow cytometry profiles. Right, values are normalized to the percentage of GFP-positive cells in I-SceI–transfected cells without treatment and represent the mean ± SD of 3 independent experiments. ****P < 0.0001 1-way ANOVA with Holm-Šidák’s multiple comparisons test.

