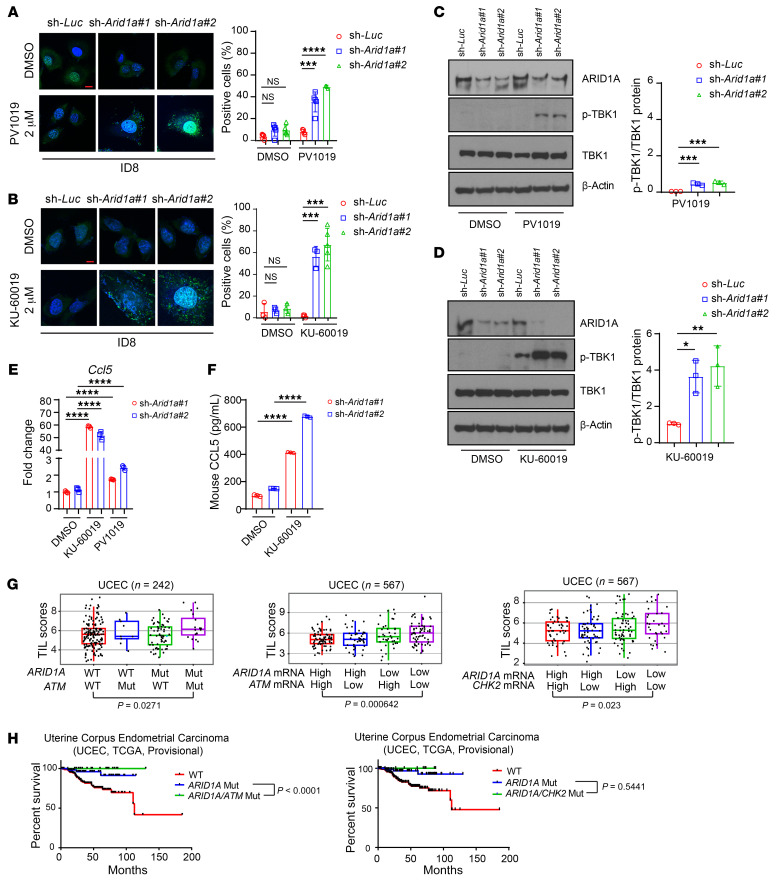
Figure 5. Inhibition of the ATM/Chk2 axis stimulates cytosolic DNA accumulation and promotes immune responsiveness in ARID1A-deficient tumors.
(A and B) Left, representative images of PicoGreen staining in control (sh-Luc) and Arid1a-depleted (sh-Arid1a#1 and #2) ID8 cells treated with DMSO, PV1019 (2 μM) (A), or KU-60019 (2 μM) (B) for 48 hours. DAPI (blue) was used to visualize the nuclei. Scale bar: 10 μm. Right, quantitative results represent the mean ± SD of 3 independent experiments. ***P < 0.001; ****P < 0.0001. (C and D) Left, Western blots of phosphorylated TBK1 (p-TBK1) and total TBK1 (TBK1) in ID8 cells treated with PV1019 (C) or KU-60019 (D) for 48 hours. Right, quantitative data represent the mean ± SD from 3 independent experiments. *P < 0.05; **P < 0.01, ***P < 0.001. (E) qPCR analysis of Ccl5 mRNA expression in ARID1A knockdown ID8 cells under DMSO, KU-60019, or PV1019 treatment. Data represent mean ± SD of 3 independent experiments. ****P < 0.0001. (F) ELISA quantification of mouse CCL5 level in ARID1A knockdown ID8 cells treated with DMSO or KU-60019. Data represent mean ± SD of 3 independent experiments. ****P < 0.0001. (G) Association of TILs with mutation and expression of ARID1A, ATM, and CHK2 in UCEC patient samples as analyzed by TIL signatures. The box plot represents median and quantiles of the data. UCEC mutation data set: n = 242, ARID1A/ATM WT/WT vs. Mut/Mut, P = 0.0271; UCEC expression data set: n = 567, ARID1A/ATM high/high vs. low/low, P = 0.000642; ARID1A/CHK2 high/high vs. low/low, P = 0.023. (H) Survival analysis for UCEC patients with ARID1A, ATM, and CHK2 mutation (Mut). Left, comutation of ARID1A and ATM. Right, comutation of ARID1A and CHK2. UCEC (n = 239): ARID1A/ATM Mut (n = 19) vs. ARID1A Mut (n = 63), P < 0.0001; ARID1A/CHK2 Mut (n = 9) vs. ARID1A Mut (n = 74), P = 0.5441. One-way ANOVA with Dunnett’s multiple comparisons test (A–D); 1-way ANOVA with Holm-Šidák’s multiple comparisons test (E and F); 2-tailed unpaired Student’s t test (G and H).

