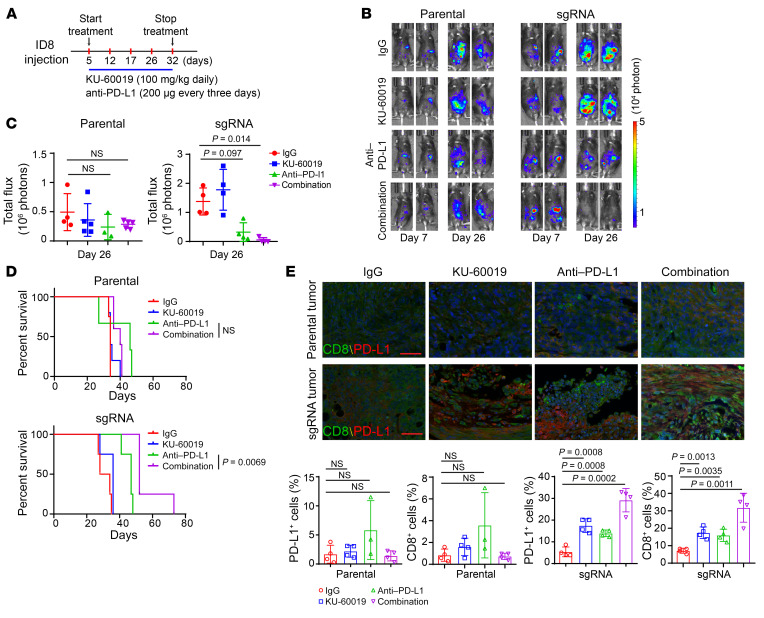
Figure 6. ATM inhibition enhances the therapeutic efficacy of ICB in ARID1A-deficient tumors.
(A) Schematic of isotype control IgG, KU-60019, and anti–PD-L1 antibody treatment. Treatments were started on day 5 after inoculation and stopped on day 32. (B) Representative images for bioluminescence of mice with i.p. ID8 tumors on day 7 and day 26. Left, parental ID8 tumors. Right, ARID1A-depleted (sgRNA) ID8 i.p. tumors. (C) Endpoint of bioluminescence in mice bearing parental and ARID1A-depleted (sgRNA) ID8 i.p. tumors. Parental: IgG vs. anti–PD-L1, not significant; IgG vs. combination, not significant. sgRNA: IgG vs. anti–PD-L1, P = 0.097; IgG vs. combination, P = 0.014. Data represent mean ± SD (n = 3–5). (D) Survival curves of mice with ID8 i.p. tumors. Top, parental ID8 tumors. Bottom, ARID1A-depleted (sgRNA) ID8 tumors. Parental: anti–PD-L1 vs. combination, not significant; sgRNA: anti–PD-L1 vs. combination, P = 0.0069. (E) Top, CD8 and PD-L1 fluorescence-based IHC staining in parental and ARID1A-depleted ID8 i.p. tumors (n = 3 or 4). Bottom, quantitative analysis represent mean ± SD with indicated P value. +, positive. Scale bar: 50 μm. Two-tailed unpaired Student’s t test (C and E); log-rank (Mantel-Cox) test (D).

